|
|
Scientific Visualization
Lecturers: A. Gyulassy, J. Tierny TA: Q. Liu
mailing list: 2009_cs6630 "at" pascucci.org (2009_cs6630-subscribe "at" pascucci.org to register) |
|
Class Information:
|
Term |
Number (index) |
Subject |
Catalog # |
Section |
Days |
Time |
Location |
Office Hours |
|
Fall 2009 |
7233 |
CS |
6630 |
0001 |
Tuesday, Thursday |
10:45 PM-12:05 PM |
WEB L112 |
TBD |
|
7232 |
5630 |
|||||||
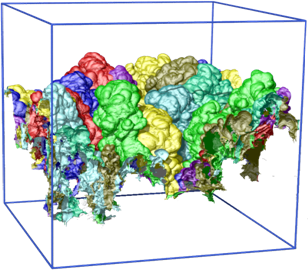
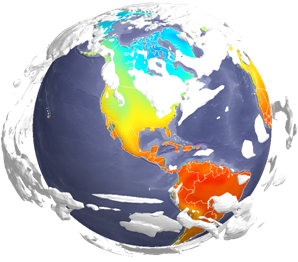
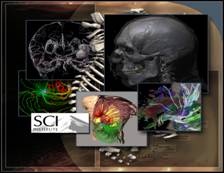
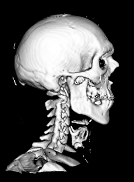
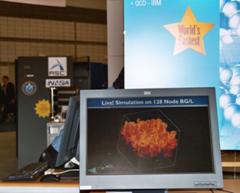
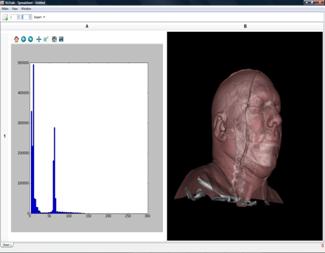
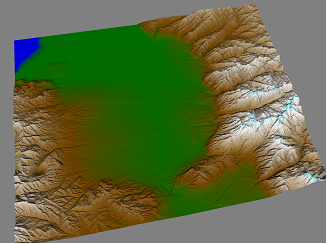
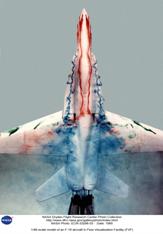
Course Overview. This course provides an introduction to Scientific Visualization techniques used for the effective presentation of data from a variety of disciplines including medicine, engineering, physics and biology. Students will learn about the use of fundamental approaches (color map selection, isocontouring, volume rendering, streamlines, etc…), as well as efficient algorithms for their computation. Special emphasis will be given to the correctness of the results provided, and the reliability of the insight provided to the users/scientists. In the study of visualization algorithms we will emphasize the selection of efficient data structures, complexity analysis, practical efficiency, and verification of the quality of the output generated. Successful completion of the course will enable the students pursuing new research directions in this field as well as applying the most recent visualization techniques for the presentation of data from simulations and experiments and aid the users in the science discovery process.
Prerequisites. There are no formal prerequisites for this class. Students will be expected to have basic knowledge of geometric data structures and algorithmic techniques.
Tentative Syllabus (changes based on student feedback will be
considered):
|
|
|
|
|
|
The scientist and the data analysis/visualization expert: discussion and homework assignment |
|||
|
August 25 |
August 27 |
September 1 |
September 3 |
|
|
|
|
|
|
September 8 |
September 10 |
September 15 |
September 17 |
|
|
|
|
|
|
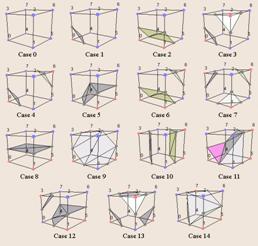
Isosurface Accelleration Techniques |
Basic Volume Rendering |
||
|
September 22 |
September 24 |
September 29 |
October 1 |
|
|
|
|
|
|
Advanced Volume Rendering |
GPU-Based Volume Rendering |
Unstructured Grids |
Transfer Function Specification |
|
October 6 |
October 8 |
October 20 |
October 22 |
|
|
|
|
|
|
Advanced Transfer Function Issues |
Tufte Principles |
Application of Tufte Principles |
Streamlines |
|
October 27 |
October 29 |
November 3 |
November 5 |
|
|
|
|
|
|
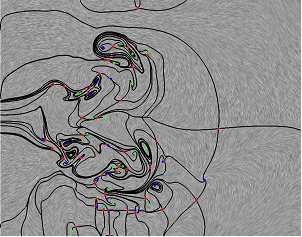
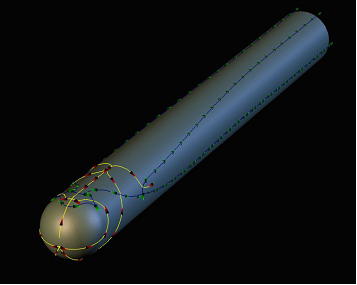
Vortices |
LIC |
Parallel Coordinates |
Basic Graph Drawing |
|
November 10 |
November 12 |
November 17 |
November 19 |
|
|
|
|
|
|
Case Studies in Scientific Visualization |
|||
|
November 24 |
December 1 |
December 3 |
December 10 |
|
|
|
|
|
|
|
|
|
|
|
December 18 Final Project Due! |
|||
Reading and supplemental material
There is no formal book for class. The instructor will distribute printouts of notes or research papers related to each lecture.
The following links include various relevant materials such as book, research papers, and software:
· Books:
· Bruce H. McCormick, Thomas A. DeFanti and Maxine D. Brown (eds.) (1987). Visualization in Scientific Computing. ACM Press.
· Gregory M. Nielson, Hans Hagen and Heinrich Müller (1997). Scientific Visualization: Overviews, Methodologies, and Techniques. IEEE Computer Society.
· Clifford A. Pickover (ed.) (1994). Frontiers of Scientific Visualization. New York: John Willey Inc.
· Lawrence J. Rosenblum (ed.) (1994). Scientific Visualization: Advances and challenges. Academic Press.
· Will Schroeder, Ken Martin, Bill Lorensen (2003). The Visualization Toolkit. Kitware, Inc.
· Other links:
· VTK
· ITK
· VisIT
· ParaView
Assignments
The students will be given individual and group assignments. The main assignment will be a project. Although the students will be provided with a list of available projects, the students are encouraged to propose projects in areas of personal interest. For larger projects the students will be allowed to work in small groups.
Late Submission of Assignments
Assignments will not be accepted late. Students will be given a one-time two-day extension for an unexpected event.
Class Participation and Absences
Participation in class is an integral part of the
course. Attendance is mandatory.
More than two unjustified absences will impact negatively the grade.
Grading
Each student will be evaluated based on:
Attendance and participation in class (20%),
Assignments (30%),
Project (40%),
Final project presentation (10%).
Students With Disabilities
The University of Utah seeks to provide equal access to its programs, services and activities for people with disabilities. If you will need accommodations in the class, reasonable prior notice needs to be given to the Center for Disability Services, 162 Olpin Union Building, 581-5020 (V/TDD). CDS will work with you and the instructor to make arrangements for accommodations.
All written information in this course can be made available in alternative format with prior notification to the Center for Disability Services.