


Image Analysis
SCI's imaging work addresses fundamental questions in 2D and 3D image processing, including filtering, segmentation, surface reconstruction, and shape analysis. In low-level image processing, this effort has produce new nonparametric methods for modeling image statistics, which have resulted in better algorithms for denoising and reconstruction. Work with particle systems has led to new methods for visualizing and analyzing 3D surfaces. Our work in image processing also includes applications of advanced computing to 3D images, which has resulted in new parallel algorithms and real-time implementations on graphics processing units (GPUs). Application areas include medical image analysis, biological image processing, defense, environmental monitoring, and oil and gas.
Ross Whitaker
Segmentation


Chris Johnson
Diffusion Tensor Analysis
Funded Research Projects:
Publications in Image Analysis:
|
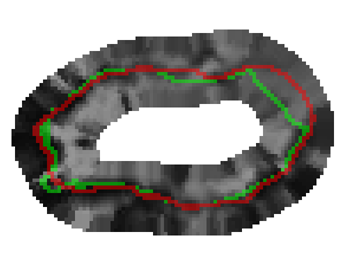
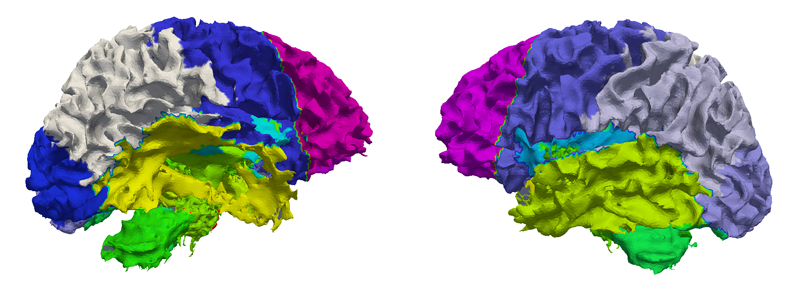
  Bayesian Segmentation of Atrium Wall using Globally-Optimal Graph Cuts on 3D Meshes G. Veni, S. Awate, Z. Fu, R.T. Whittaker. In Proceedings of the International Conference on Information Processing in Medical Imaging (IPMI), Lecture Notes in Computer Science (LNCS), Vol. 23, pp. 656--677. 2013. PubMed ID: 24684007 Efficient segmentation of the left atrium (LA) wall from delayed enhancement MRI is challenging due to inconsistent contrast, combined with noise, and high variation in atrial shape and size. We present a surface-detection method that is capable of extracting the atrial wall by computing an optimal a-posteriori estimate. This estimation is done on a set of nested meshes, constructed from an ensemble of segmented training images, and graph cuts on an associated multi-column, proper-ordered graph. The graph/mesh is a part of a template/model that has an associated set of learned intensity features. When this mesh is overlaid onto a test image, it produces a set of costs which lead to an optimal segmentation. The 3D mesh has an associated weighted, directed multi-column graph with edges that encode smoothness and inter-surface penalties. Unlike previous graph-cut methods that impose hard constraints on the surface properties, the proposed method follows from a Bayesian formulation resulting in soft penalties on spatial variation of the cuts through the mesh. The novelty of this method also lies in the construction of proper-ordered graphs on complex shapes for choosing among distinct classes of base shapes for automatic LA segmentation. We evaluate the proposed segmentation framework on simulated and clinical cardiac MRI. Keywords: Atrial Fibrillation, Bayesian segmentation, Minimum s-t cut, Mesh Generation, Geometric Graph |
|
A Hierarchical Geodesic Model for Diffeomorphic Longitudinal Shape Analysis N.P. Singh, J. Hinkle, S. Joshi, P.T. Fletcher. In Proceedings of the International Conference on Information Processing in Medical Imaging (IPMI), Lecture Notes in Computer Science (LNCS), pp. (accepted). 2013. Hierarchical linear models (HLMs) are a standard approach for analyzing data where individuals are measured repeatedly over time. However, such models are only applicable to longitudinal studies of Euclidean data. In this paper, we propose a novel hierarchical geodesic model (HGM), which generalizes HLMs to the manifold setting. Our proposed model explains the longitudinal trends in shapes represented as elements of the group of diffeomorphisms. The individual level geodesics represent the trajectory of shape changes within individuals. The group level geodesic represents the average trajectory of shape changes for the population. We derive the solution of HGMs on diffeomorphisms to estimate individual level geodesics, the group geodesic, and the residual geodesics. We demonstrate the effectiveness of HGMs for longitudinal analysis of synthetically generated shapes and 3D MRI brain scans. |
|
A Vector Momenta Formulation of Diffeomorphisms for Improved Geodesic Regression and Atlas Construction N.P. Singh, J. Hinkle, S. Joshi, P.T. Fletcher. In Proceedings of the 2013 IEEE 10th International Symposium on Biomedical Imaging (ISBI), Note: Received Best Student Paper Award, pp. 1219--1222. 2013. DOI: 10.1109/ISBI.2013.6556700 This paper presents a novel approach for diffeomorphic image regression and atlas estimation that results in improved convergence and numerical stability. We use a vector momenta representation of a diffeomorphism's initial conditions instead of the standard scalar momentum that is typically used. The corresponding variational problem results in a closed form update for template estimation in both the geodesic regression and atlas estimation problems. While we show that the theoretical optimal solution is equivalent to the scalar momenta case, the simplification of the optimization problem leads to more stable and efficient estimation in practice. We demonstrate the effectiveness of our method for atlas estimation and geodesic regression using synthetically generated shapes and 3D MRI brain scans. Keywords: LDDMM, Geodesic regression, Atlas, Vector Momentum |
|
Proper Ordered Meshing of Complex Shapes and Optimal Graph Cuts Applied to Atrial-Wall Segmentation from DE-MRI G. Veni, Z. Fu, S.P. Awate, R.T. Whitaker. In Proceedings of the 2013 IEEE 10th International Symposium on Biomedical Imaging (ISBI), pp. 1296--1299. 2013. DOI: 10.1109/ISBI.2013.6556769 Segmentation of the left atrium wall from delayed enhancement MRI is challenging because of inconsistent contrast combined with noise and high variation in atrial shape and size. This paper presents a method for left-atrium wall segmentation by using a novel sophisticated mesh-generation strategy and graph cuts on a proper ordered graph. The mesh is part of a template/model that has an associated set of learned intensity features. When this mesh is overlaid onto a test image, it produces a set of costs on the graph vertices which eventually leads to an optimal segmentation. The novelty also lies in the construction of proper ordered graphs on complex shapes and for choosing among distinct classes of base shapes/meshes for automatic segmentation. We evaluate the proposed segmentation framework quantitatively on simulated and clinical cardiac MRI. |
|
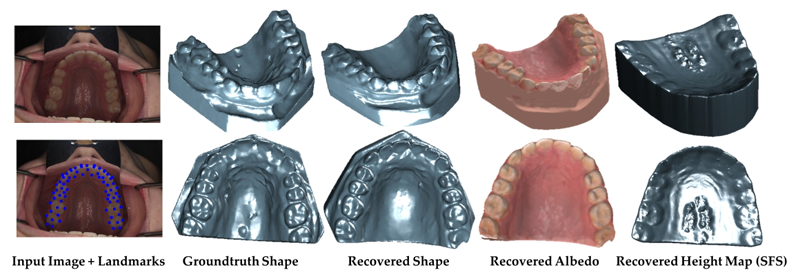
Clinical Crowns Shape Reconstruction - An Image-based Approach S. Elhabian, A. Farag, D. Tasman, W. Aboelmaaty, A. Farman. In Proceedings of the 2013 IEEE 10th International Symposium on Biomedical Imaging (ISBI), pp. 93--96. 2013. DOI: 10.1109/ISBI.2013.6556420 Precise knowledge of the 3D shape of clinical crowns is crucial for the treatment of malocclusion problems as well as several endodontic procedures. While Computed Tomography (CT) would present such information, it is believed that there is no threshold radiation dose below which it is considered safe. In this paper, we propose an image-based approach which allows for the construction of plausible human jaw models in vivo, without ionizing radiation, using fewer sample points in order to reduce the cost and intrusiveness of acquiring models of patients teeth/jaws over time. We assume that human teeth reflectance obeys Wolff-Oren-Nayar model where we experimentally prove that teeth surface obeys the microfacet theory. The inherent relation between the photometric information and the underlying 3D shape is formulated as a statistical model where the coupled effect of illumination and reflectance is modeled using the Helmhotlz Hemispherical Harmonics (HSH)-based irradiance harmonics whereas the Principle Component Regression (PCR) approach is deployed to carry out the estimation of dense 3D shapes. Vis-a-vis dental applications, the results demonstrate a significant increase in accuracy in favor of the proposed approach where our system is evaluated on a database of 16 jaws. |
|
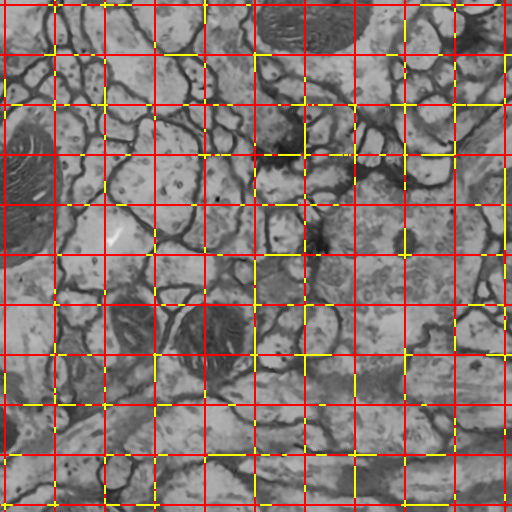
Semi-Automatic Neuron Segmentation in Electron Microscopy Images Via Sparse Labeling C. Jones, T. Liu, M. Ellisman, T. Tasdizen. In Proceedings of the 2013 IEEE 10th International Symposium on Biomedical Imaging (ISBI), pp. 1304--1307. April, 2013. DOI: 10.1109/ISBI.2013.6556771 We introduce a novel method for utilizing user input to sparsely label membranes in electron microscopy images. Using gridlines as guides, the user marks where the guides cross the membrane to generate a sparsely labeled image. We use a best path algorithm to connect each of the sparse membrane labels. The resulting segmentation has a significantly better Rand error than automatic methods while requiring as little as 2\% of the image to be labeled. |
|
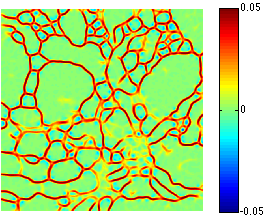
Neuron Segmentation in Electron Microscopy Images Using Partial Differential Equations C. Jones, M. Seyedhosseini, M. Ellisman, T. Tasdizen. In Proceedings of 2013 IEEE 10th International Symposium on Biomedical Imaging (ISBI), pp. 1457--1460. April, 2013. DOI: 10.1109/ISBI.2013.6556809 In connectomics, neuroscientists seek to identify the synaptic connections between neurons. Segmentation of cell membranes using supervised learning algorithms on electron microscopy images of brain tissue is often done to assist in this effort. Here we present a partial differential equation with a novel growth term to improve the results of a supervised learning algorithm. We also introduce a new method for representing the resulting image that allows for a more dynamic thresholding to further improve the result. Using these two processes we are able to close small to medium sized gaps in the cell membrane detection and improve the Rand error by as much as 9\% over the initial supervised segmentation. |
|
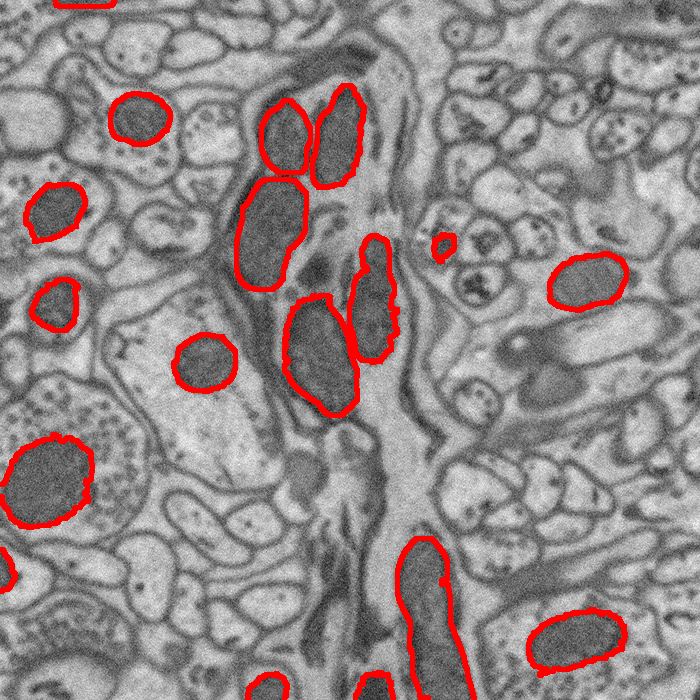
Segmentation of Mitochondria in Electron Microscopy Images using Algebraic Curves M. Seyedhosseini, M. Ellisman, T. Tasdizen. In Proceedings of the 2013 IEEE 10th International Symposium on Biomedical Imaging (ISBI), pp. 860--863. 2013. DOI: 10.1109/ISBI.2013.6556611 High-resolution microscopy techniques have been used to generate large volumes of data with enough details for understanding the complex structure of the nervous system. However, automatic techniques are required to segment cells and intracellular structures in these multi-terabyte datasets and make anatomical analysis possible on a large scale. We propose a fully automated method that exploits both shape information and regional statistics to segment irregularly shaped intracellular structures such as mitochondria in electron microscopy (EM) images. The main idea is to use algebraic curves to extract shape features together with texture features from image patches. Then, these powerful features are used to learn a random forest classifier, which can predict mitochondria locations precisely. Finally, the algebraic curves together with regional information are used to segment the mitochondria at the predicted locations. We demonstrate that our method outperforms the state-of-the-art algorithms in segmentation of mitochondria in EM images. |
| Modeling Longitudinal MRI Changes in Populations Using a Localized, Information-Theoretic Measure of Contrast A. Vardhan, M.W. Prastawa, J. Piven, G. Gerig. In Proceedings of the 2013 IEEE 10th International Symposium on Biomedical Imaging (ISBI), pp. 1396--1399. 2013. DOI: 10.1109/ISBI.2013.6556794 Longitudinal MR imaging during early brain development provides important information about growth patterns and the development of neurological disorders. We propose a new framework for studying brain growth patterns within and across populations based on MRI contrast changes, measured at each time point of interest and at each voxel. Our method uses regression in the LogOdds space and an informationtheoretic measure of distance between distributions to capture contrast in a manner that is robust to imaging parameters and without requiring intensity normalization. We apply our method to a clinical neuroimaging study on early brain development in autism, where we obtain a 4D spatiotemporal model of contrast changes in multimodal structural MRI. |
|
Analyzing Imaging Biomarkers for Traumatic Brain Injury Using 4D Modeling of Longitudinal MRI Bo Wang, M.W. Prastawa, A. Irimia, M.C. Chambers, N. Sadeghi, P.M. Vespa, J.D. van Horn, G. Gerig. In 2013 IEEE Proceedings of 10th International Symposium on Biomedical Imaging (ISBI), pp. 1392 - 1395. 2013. DOI: 10.1109/ISBI.2013.6556793 Quantitative imaging biomarkers are important for assessment of impact, recovery and treatment efficacy in patients with traumatic brain injury (TBI). To our knowledge, the identification of such biomarkers characterizing disease progress and recovery has been insufficiently explored in TBI due to difficulties in registration of baseline and followup data and automatic segmentation of tissue and lesions from multimodal, longitudinal MR image data. We propose a new methodology for computing imaging biomarkers in TBI by extending a recently proposed spatiotemporal 4D modeling approach in order to compute quantitative features of tissue change. The proposed method computes surface-based and voxel-based measurements such as cortical thickness, volume changes, and geometric deformation. We analyze the potential for clinical use of these biomarkers by correlating them with TBI-specific patient scores at the level of the whole brain and of individual regions. Our preliminary results indicate that the proposed voxel-based biomarkers are correlated with clinical outcomes. |
|
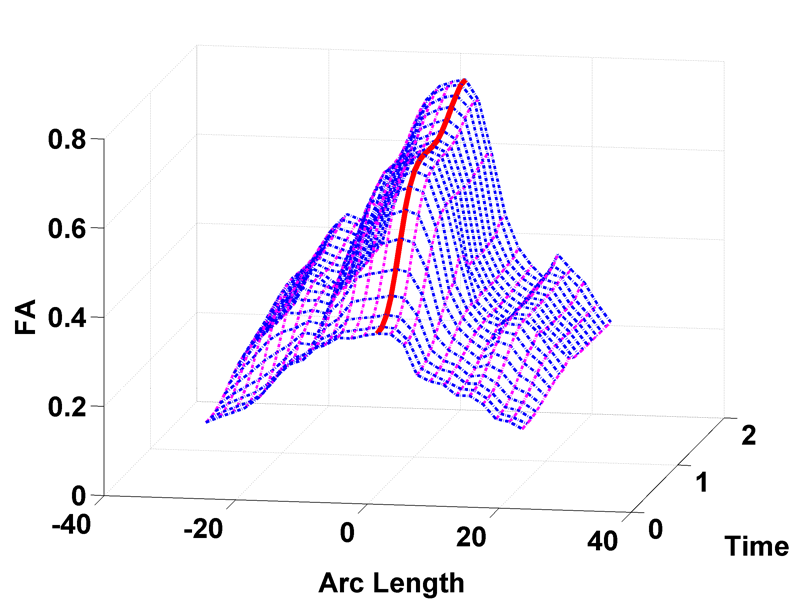
Spatiotemporal Modeling of Discrete-Time Distribution-Valued Data Applied to DTI Tract Evolution in Infant Neurodevelopment A. Sharma, P.T. Fletcher, J.H. Gilmore, M.L. Escolar, A. Gupta, M. Styner, G. Gerig. In Proceedings of the 2013 IEEE 10th International Symposium on Biomedical Imaging (ISBI), pp. 684--687. 2013. DOI: 10.1109/ISBI.2013.6556567 This paper proposes a novel method that extends spatiotemporal growth modeling to distribution-valued data. The method relaxes assumptions on the underlying noise models by considering the data to be represented by the complete probability distributions rather than a representative, single-valued summary statistics like the mean. When summarizing by the latter method, information on the underlying variability of data is lost early in the process and is not available at later stages of statistical analysis. The concept of ’distance’ between distributions and an ’average’ of distributions is employed. The framework quantifies growth trajectories for individuals and populations in terms of the complete data variability estimated along time and space. Concept is demonstrated in the context of our driving application which is modeling of age-related changes along white matter tracts in early neurodevelopment. Results are shown for a single subject with Krabbe's disease in comparison with a normative trend estimated from 15 healthy controls. |
|
Multivariate Modeling of Longitudinal MRI in Early Brain Development with Confidence Measures N. Sadeghi, M.W. Prastawa, P.T. Fletcher, C. Vachet, Bo Wang, J.H. Gilmore, G. Gerig. In Proceedings of the 2013 IEEE 10th International Symposium on Biomedical Imaging (ISBI), pp. 1400--1403. 2013. DOI: 10.1109/ISBI.2013.6556795 The human brain undergoes rapid organization and structuring early in life. Longitudinal imaging enables the study of these changes over a developmental period within individuals through estimation of population growth trajectory and its variability. In this paper, we focus on maturation of white and gray matter as is depicted in structural and diffusion MRI of healthy subjects with repeated scans. We provide a framework for joint analysis of both structural MRI and DTI (Diffusion Tensor Imaging) using multivariate nonlinear mixed effect modeling of temporal changes. Our framework constructs normative growth models for all the modalities that take into account the correlation among the modalities and individuals, along with estimation of the variability of the population trends. We apply our method to study early brain development, and to our knowledge this is the first multimodel longitudinal modeling of diffusion and signal intensity changes for this growth stage. Results show the potential of our framework to study growth trajectories, as well as neurodevelopmental disorders through comparison against the constructed normative models of multimodal 4D MRI. |
| White Matter Microstructure and Atypical Visual Orienting in 7 Month-Olds at Risk for Autism J.T. Elison, S.J. Paterson, J.J. Wolff, J.S. Reznick, N.J. Sasson, H. Gu, K.N. Botteron, S.R. Dager, A.M. Estes, A.C. Evans, G. Gerig, H.C. Hazlett, R.T. Schultz, M. Styner, L. Zwaigenbaum, J. Piven for the IBIS Network. In American Journal of Psychiatry, Vol. AJP-12-09-1150.R2, March, 2013. DOI: 10.1176/appi.ajp.2012.12091150 PubMed ID: 23511344 Objective: To determine whether specific patterns of oculomotor functioning and visual orienting characterize 7 month-old infants later classified with an autism spectrum disorder (ASD) and to identify the neural correlates of these behaviors. Method: Ninety-seven infants contributed data to the current study (16 high-familial risk infants later classified with an ASD, 40 high-familial risk infants not meeting ASD criteria (high-risk-negative), and 41 low-risk infants). All infants completed an eye tracking task at 7 months and a clinical assessment at 25 months; diffusion weighted imaging data was acquired on 84 infants at 7 months. Primary outcome measures included average saccadic reaction time in a visually guided saccade procedure and radial diffusivity (an index of white matter organization) in fiber tracts that included corticospinal pathways and the splenium and genu of the corpus callosum. Results: Visual orienting latencies were increased in seven-month-old infants who later express ASD symptoms at 25 months when compared with both high-risk-negative infants (p = 0.012, d = 0.73) and low-risk infants (p = 0.032, d = 0.71). Visual orienting latencies were uniquely associated with the microstructural organization of the splenium of the corpus callosum in low-risk infants, but this association was not apparent in infants later classified with ASD. Conclusions: Flexibly and efficiently orienting to salient information in the environment is critical for subsequent cognitive and social-cognitive development. Atypical visual orienting may represent an earlyemerging prodromal feature of ASD, and abnormal functional specialization of posterior cortical circuits directly informs a novel model of ASD pathogenesis. |
|
Regional characterization of longitudinal DT-MRI to study white matter maturation of the early developing brain N. Sadeghi, M.W. Prastawa, P.T. Fletcher, J. Wolff, J.H. Gilmore, G. Gerig. In NeuroImage, Vol. 68, pp. 236--247. March, 2013. DOI: 10.1016/j.neuroimage.2012.11.040 PubMed ID: 23235270 The human brain undergoes rapid and dynamic development early in life. Assessment of brain growth patterns relevant to neurological disorders and disease requires a normative population model of growth and variability in order to evaluate deviation from typical development. In this paper, we focus on maturation of brain white matter as shown in diffusion tensor MRI (DT-MRI), measured by fractional anisotropy (FA), mean diffusivity (MD), as well as axial and radial diffusivities (AD, RD). We present a novel methodology to model temporal changes of white matter diffusion from longitudinal DT-MRI data taken at discrete time points. Our proposed framework combines nonlinear modeling of trajectories of individual subjects, population analysis, and testing for regional differences in growth pattern. We first perform deformable mapping of longitudinal DT-MRI of healthy infants imaged at birth, 1 year, and 2 years of age, into a common unbiased atlas. An existing template of labeled white matter regions is registered to this atlas to define anatomical regions of interest. Diffusivity properties of these regions, presented over time, serve as input to the longitudinal characterization of changes. We use non-linear mixed effect (NLME) modeling where temporal change is described by the Gompertz function. The Gompertz growth function uses intuitive parameters related to delay, rate of change, and expected asymptotic value; all descriptive measures which can answer clinical questions related to quantitative analysis of growth patterns. Results suggest that our proposed framework provides descriptive and quantitative information on growth trajectories that can be interpreted by clinicians using natural language terms that describe growth. Statistical analysis of regional differences between anatomical regions which are known to mature differently demonstrates the potential of the proposed method for quantitative assessment of brain growth and differences thereof. This will eventually lead to a prediction of white matter diffusion properties and associated cognitive development at later stages given imaging data at early stages. |
|
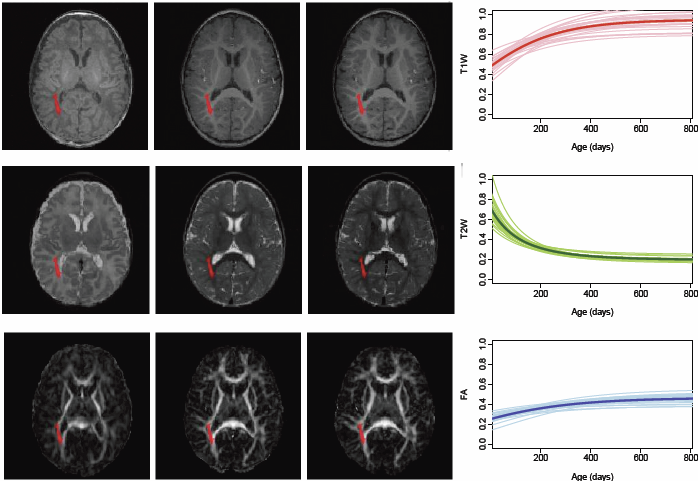
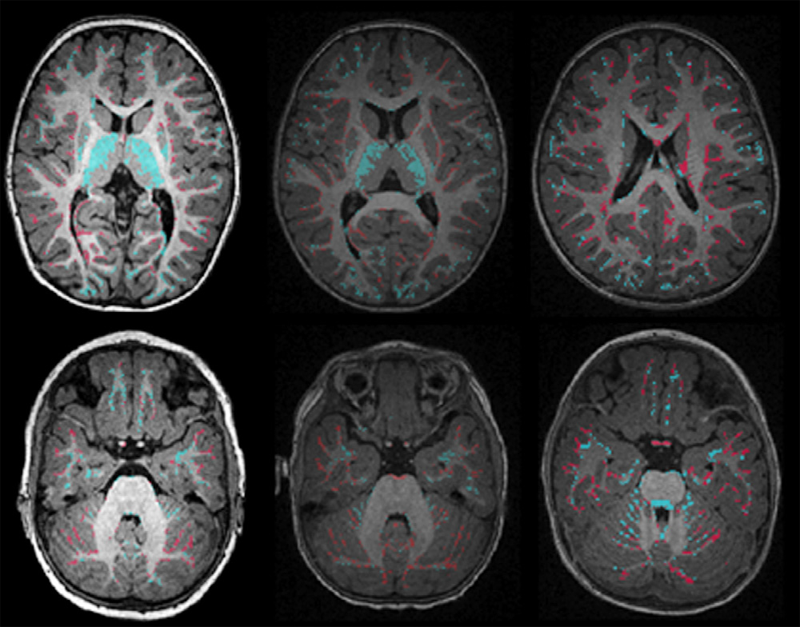
Adaptive prior probability and spatial temporal intensity change estimation for segmentation of the one-year-old human brain S.H. Kim, V. Fonov, C. Dietrich, C. Vachet, H.C. Hazlett, R.G. Smith, M. Graves, J. Piven, J.H. Gilmore, D.L. Collins, G. Gerig, M. Styner, The IBIS network. In Journal of Neuroscience Methods, Vol. 212, No. 1, Note: Published online Sept. 29, pp. 43--55. January, 2013. DOI: 10.1016/j.jneumeth.2012.09.01 PubMed Central ID: PMC3513941 The degree of white matter (WM) myelination is rather inhomogeneous across the brain. White matter appears differently across the cortical lobes in MR images acquired during early postnatal development. Specifically at 1-year of age, the gray/white matter contrast of MR T1 and T2 weighted images in prefrontal and temporal lobes is reduced as compared to the rest of the brain, and thus, tissue segmentation results commonly show lower accuracy in these lobes. In this novel work, we propose the use of spatial intensity growth maps (IGM) for T1 and T2 weighted images to compensate for local appearance inhomogeneity. The IGM captures expected intensity changes from 1 to 2 years of age, as appearance homogeneity is greatly improved by the age of 24 months. The IGM was computed as the coefficient of a voxel-wise linear regression model between corresponding intensities at 1 and 2 years. The proposed IGM method revealed low regression values of 1–10\% in GM and CSF regions, as well as in WM regions at maturation stage of myelination at 1 year. However, in the prefrontal and temporal lobes we observed regression values of 20–25\%, indicating that the IGM appropriately captures the expected large intensity change in these lobes mainly due to myelination. The IGM is applied to cross-sectional MRI datasets of 1-year-old subjects via registration, correction and tissue segmentation of the IGM-corrected dataset. We validated our approach in a small leave-one-out study of images with known, manual 'ground truth' segmentations. |
|
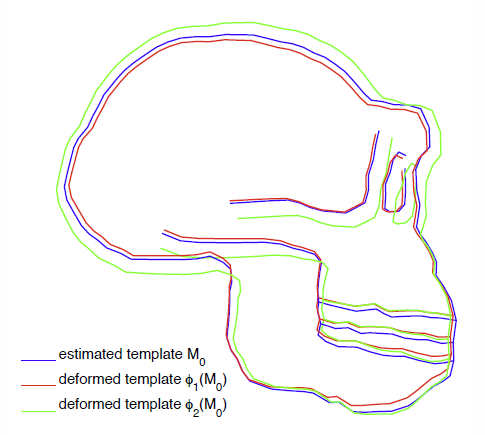
Toward a comprehensive framework for the spatiotemporal statistical analysis of longitudinal shape data S. Durrleman, X. Pennec, A. Trouvé, J. Braga, G. Gerig, N. Ayache. In International Journal of Computer Vision (IJCV), Vol. 103, No. 1, pp. 22--59. September, 2013. DOI: 10.1007/s11263-012-0592-x This paper proposes an original approach for the statistical analysis of longitudinal shape data. The proposed method allows the characterization of typical growth patterns and subject-specific shape changes in repeated time-series observations of several subjects. This can be seen as the extension of usual longitudinal statistics of scalar measurements to high-dimensional shape or image data. The method is based on the estimation of continuous subject-specific growth trajectories and the comparison of such temporal shape changes across subjects. Differences between growth trajectories are decomposed into morphological deformations, which account for shape changes independent of the time, and time warps, which account for different rates of shape changes over time. Given a longitudinal shape data set, we estimate a mean growth scenario representative of the population, and the variations of this scenario both in terms of shape changes and in terms of change in growth speed. Then, intrinsic statistics are derived in the space of spatiotemporal deformations, which characterize the typical variations in shape and in growth speed within the studied population. They can be used to detect systematic developmental delays across subjects. In the context of neuroscience, we apply this method to analyze the differences in the growth of the hippocampus in children diagnosed with autism, developmental delays and in controls. Result suggest that group differences may be better characterized by a different speed of maturation rather than shape differences at a given age. In the context of anthropology, we assess the differences in the typical growth of the endocranium between chimpanzees and bonobos. We take advantage of this study to show the robustness of the method with respect to change of parameters and perturbation of the age estimates. |
|
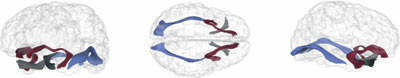
Frontolimbic neural circuitry at 6 months predicts individual differences in joint attention at 9 months J.T. Elison, J.J. Wolff, D.C. Heimer, S.J. Paterson, H. Gu, M. Styner, G. Gerig, J. Piven, the IBIS Network. In Developmental Science, Vol. 16, No. 2, Wiley-Blackwell, pp. 186--197. 2013. DOI: 10.1111/desc.12015 PubMed Central ID: PMC3582040 Elucidating the neural basis of joint attention in infancy promises to yield important insights into the development of language and social cognition, and directly informs developmental models of autism.We describe a new method for evaluating responding to joint attention performance in infancy that highlights the 9- to 10-month period as a time interval of maximal individual differences.We then demonstrate that fractional anisotropy in the right uncinate fasciculus, a white matter fiber bundle connecting the amygdala to the ventral-medial prefrontal cortex and anterior temporal pole, measured in 6-month-olds predicts individual differences in responding to joint attention at 9 months of age. The white matter microstructure of the right uncinate was not related to receptive language ability at 9 months. These findings suggest that the development of core nonverbal social communication skills in infancy is largely supported by preceding developments within right lateralized frontotemporal brain systems. |
|
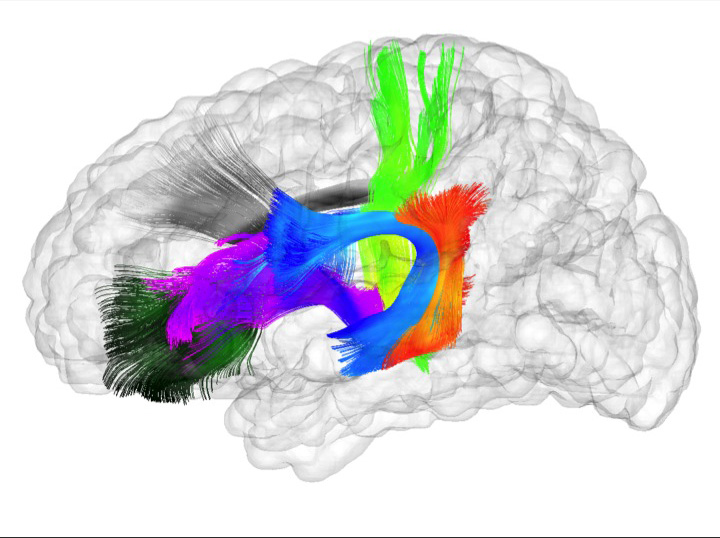
Associations Between White Matter Microstructure and Infants' Working Memory S. Short, J.T. Elison, B.D. Goldman, M. Styner, H. Gu, M. Connelly, E. Maltbie, S. Woolson, W. Lin, G. Gerig, J.S. Reznick, J.H. Gilmore. In Neuroimage, Vol. 64, No. 1, Elsvier, pp. 156--166. January, 2013. DOI: 10.1016/j.neuroimage.2012.09.021 PubMed ID: 22989623 Working memory emerges in infancy and plays a privileged role in subsequent adaptive cognitive development. The neural networks important for the development of working memory during infancy remain unknown. We used diffusion tensor imaging (DTI) and deterministic fiber tracking to characterize the microstructure of white matter fiber bundles hypothesized to support working memory in 12-month-old infants (n=73). Here we show robust associations between infants' visuospatial working memory performance and microstructural characteristics of widespread white matter. Significant associations were found for white matter tracts that connect brain regions known to support working memory in older children and adults (genu, anterior and superior thalamic radiations, anterior cingulum, arcuate fasciculus, and the temporal-parietal segment). Better working memory scores were associated with higher FA and lower RD values in these selected white matter tracts. These tract-specific brain-behavior relationships accounted for a significant amount of individual variation above and beyond infants' gestational age and developmental level, as measured with the Mullen Scales of Early Learning. Working memory was not associated with global measures of brain volume, as expected, and few associations were found between working memory and control white matter tracts. To our knowledge, this study is among the first demonstrations of brain-behavior associations in infants using quantitative tractography. The ability to characterize subtle individual differences in infant brain development associated with complex cognitive functions holds promise for improving our understanding of normative development, biomarkers of risk, experience-dependent learning and neuro-cognitive periods of developmental plasticity. |
|
Localized differences in caudate and hippocampal shape associated with schizophrenia but not antipsychotic type R.K. McClure, M. Styner, J.A. Lieberman, S. Gouttard, G. Gerig, X. Shi, H. Zhu. In Psychiatry Research: Neuroimaging, Vol. 211, No. 1, pp. 1--10. January, 2013. DOI: 10.1016/j.pscychresns.2012.07.001 PubMed Central ID: PMC3557605 Caudate and hippocampal volume differences in patients with schizophrenia are associated with disease and antipsychotic treatment, but local shape alterations have not been thoroughly examined. Schizophrenia patients randomly assigned to haloperidol and olanzapine treatment underwent magnetic resonance imaging (MRI) at 3, 6, and 12 months. The caudate and hippocampus were represented as medial representations (M-reps); mesh structures derived from automatic segmentations of high resolution MRIs. Two quantitative shape measures were examined: local width and local deformation. A novel nonparametric statistical method, adjusted exponentially tilted (ET) likelihood, was used to compare the shape measures across the three groups while controlling for covariates. Longitudinal shape change was not observed in the hippocampus or caudate when the treatment groups and controls were examined in a global analysis, nor when the three groups were examined individually. Both baseline and repeated measures analysis showed differences in local caudate and hippocampal size between patients and controls, while no consistent differences were shown between treatment groups. Regionally specific differences in local hippocampal and caudate shape are present in schizophrenic patients. Treatment-related related longitudinal shape change was not observed within the studied timeframe. Our results provide additional evidence for disrupted cortico-basal ganglia-thalamo-cortical circuits in schizophrenia. CLINICAL TRIAL INFORMATION: This longitudinal study was conducted from March 1, 1997 to July 31, 2001 at 14 academic medical centers (11 in the United States, one in Canada, one in the Netherlands, and one in England). This study was performed prior to the establishment of centralized registries of federally and privately supported clinical trials. |
|
Axon segmentation in microscopy images - A graphical model based approach F.N. Golabchi, D.H. Brooks. In Proceedings of the 9th IEEE International Symposium on Biomedical Imaging (ISBI), pp. 756-759. 2012. DOI: 10.1109/ISBI.2012.6235658 Image segmentation of very large and complex microscopy images are challenging due to variability in the images and the need for algorithms to be robust, fast and able to incorporate various types of information and constraints in the segmentation model. In this paper we propose a graphical model based image segmentation framework that combines the information in images regions with the information in their boundary in a unified probabilistic formulation. |