
SCI Publications
2025
![]()
J.K. Holmen, M. Garcia, A. Sanderson, A. Bagusetty, M. Berzins.
“Lessons Learned and Scalability Achieved when Porting Uintah to DOE Exascale Systems,” In Proceedings of the AMTE workshop (accepted), 2025.
A key challenge faced when preparing codes for Department of Energy (DOE) exascale systems was designing scalable applications for systems featuring hardware and software not yet available at leadership class scale. With such systems now available, it is important to evaluate scalability of the resulting software solutions on these target systems. One such code designed with the exascale DOE Aurora and DOE Frontier systems in mind is the Uintah Computational Framework, an open-source asynchronous many-task (AMT) runtime system. To prepare for exascale, Uintah adopted a portable MPI+X hybrid parallelism approach using the Kokkos performance portability library (i.e., MPI+Kokkos). This paper complements recent work with additional details and an evaluation of the resulting approach on Aurora and Frontier. Results are shown for a challenging benchmark demonstrating interoperability of 3 portable codes essential to Uintah-related combustion research. These results demonstrate single-source portability across Aurora and Frontier with scaling characteristics shown to 3,072 Aurora nodes and 9,216 Frontier nodes. In addition to showing results run to new scales on new systems, this paper also discusses lessons learned through efforts preparing Uintah for exascale systems.
2024
![]()
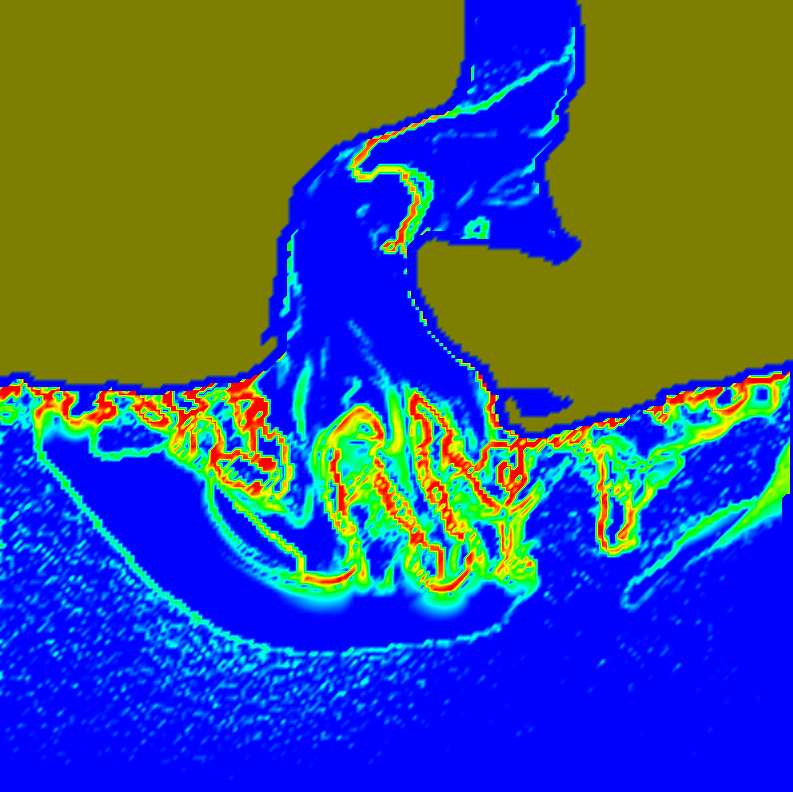
J. K. Holmen , M. Garcıa, A. Bagusetty, V. Madananth, A. Sanderson,, M. Berzins.
“Making Uintah Performance Portable for Department of Energy Exascale Testbeds,” In Euro-Par 2023: Parallel Processing, pp. 1--12. 2024.
To help ease ports to forthcoming Department of Energy (DOE) exascale systems, testbeds have been made available to select users. These testbeds are helpful for preparing codes to run on the same hardware and similar software as in their respective exascale systems. This paper describes how the Uintah Computational Framework, an open-source asynchronous many-task (AMT) runtime system, has been modified to be performance portable across the DOE Crusher, DOE Polaris, and DOE Sunspot testbeds in preparation for portable simulations across the exascale DOE Frontier and DOE Aurora systems. The Crusher, Polaris, and Sunspot testbeds feature the AMD MI250X, NVIDIA A100, and Intel PVC GPUs, respectively. This performance portability has been made possible by extending Uintah’s intermediate portability layer [18] to additionally support the Kokkos::HIP, Kokkos::OpenMPTarget, and Kokkos::SYCL back-ends. This paper also describes notable updates to Uintah’s support for Kokkos, which were required to make this extension possible. Results are shown for a challenging radiative heat transfer calculation, central to the University of Utah’s predictive boiler simulations. These results demonstrate single-source portability across AMD-, NVIDIA-, and Intel-based GPUs using various Kokkos back-ends.
2019
![]()
A. Sanderson, A. Humphrey, J. Schmidt, R. Sisneros,, M. Papka.
“ In situ visualization of performance metrics in multiple domains,” In 2019 IEEE/ACM International Workshop on Programming and Performance Visualization Tools (ProTools), IEEE, Nov, 2019.
DOI: 10.1109/protools49597.2019.00014
As application scientists develop and deploy simulation codes on to leadership-class computing resources, there is a need to instrument these codes to better understand performance to efficiently utilize these resources. This instrumentation may come from independent third-party tools that generate and store performance metrics or from custom instrumentation tools built directly into the application. The metrics collected are then available for visual analysis, typically in the domain in which there were collected. In this paper, we introduce an approach to visualize and analyze the performance metrics in situ in the context of the machine, application, and communication domains (MAC model) using a single visualization tool. This visualization model provides a holistic view of the application performance in the context of the resources where it is executing.
2018
![]()
A. Sanderson, A. Humphrey, J. Schmidt, R. Sisneros.
“Coupling the Uintah Framework and the VisIt Toolkit for Parallel In Situ Data Analysis and Visualization and Computational Steering,” In High Performance Computing, June, 2018.
Data analysis and visualization are an essential part of the scientific discovery process. As HPC simulations have grown, I/O has become a bottleneck, which has required scientists to turn to in situ tools for simulation data exploration. Incorporating additional data, such as runtime performance data, into the analysis or I/O phases of a workflow is routinely avoided for fear of excaberting performance issues. The paper presents how the Uintah Framework, a suite of HPC libraries and applications for simulating complex chemical and physical reactions, was coupled with VisIt, an interactive analysis and visualization toolkit, to allow scientists to perform parallel in situ visualization of simulation and runtime performance data. An additional benefit of the coupling made it possible to create a "simulation dashboard" that allowed for in situ computational steering and visual debugging.
![]()
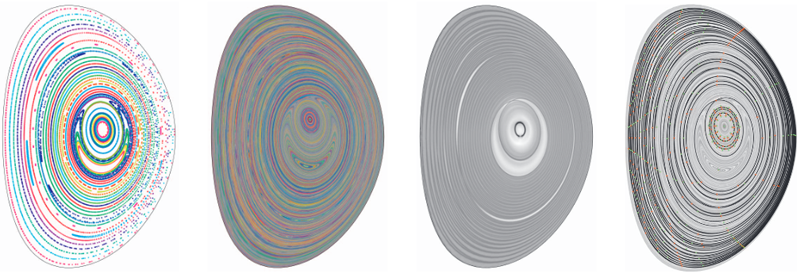
A. Sanderson, X. Tricoche.
“Exploration of periodic flow fields,” In 18th International Symposium on Flow Visualization, 2018.
One of the difficulties researchers face when exploring flow fields is understanding the respective strengths and limitations of the visualization and analysis techniques that can be applied to their particular problem. We consider in this paper the visualization of doubly periodic flow fields. Specifically, we compare and contrast two traditional visualization techniques, the Poincaré plot and the finite-time Lyapunov exponent (FTLE) plot with a technique recently proposed by the authors, which enhances the Poincaré plot with analytical results that reveal the topology. As is often the case, no single technique achieves a holistic visualization of the flow field that would address all the needs of the analysis. Instead, we show that additional insight can be gained from applying them in combination.
2014
![]()
A.R. Sanderson.
“An Alternative Formulation of Lyapunov Exponents for Computing Lagrangian Coherent Structures,” In Proceedings of the 2014 IEEE Pacific Visualization Symposium (PacificVis), Yokahama Japan, 2014.
2012
![]()
A.R. Sanderson, B. Whitlock, O. Reubel, H. Childs, G.H. Weber, Prabhat, K. Wu.
“A System for Query Based Analysis and Visualization,” In Proceedings of the Third International Eurovis Workshop on Visual Analytics EuroVA 2012, pp. 25--29. June, 2012.
Today scientists are producing large volumes of data that they wish to explore and visualize. In this paper we describe a system that combines range-based queries with fast lookup to allow a scientist to quickly and efficiently ask \"what if?\" questions. Unique to our system is the ability to perform "cumulative queries" that work on both an intra- and inter-time step basis. The results of such queries are visualized as frequency histograms and are the input for secondary queries, the results of which are then visualized.
A.R. Sanderson, G. Chen, X. Tricoche, E. Cohen.
“Understanding Quasi-Periodic Fieldlines and Their Topology in Toroidal Magnetic Fields,” In Topological Methods in Data Analysis and Visualization II, Edited by R. Peikert and H. Carr and H. Hauser and R. Fuchs, Springer, pp. 125--140. 2012.
DOI: 10.1007/478-3-642-23175-9
![]()
X. Tricoche, C. Garth, A. Sanderson, K. Joy.
“Visualizing Invariant Manifolds in Area-Preserving Maps,” In Topological Methods in Data Analysis and Visualization II: Theory, Algorithms, and Applications, Edited by R. Peikert, H. Hauser, H. Carr, R. Fuchs, Springer Berlin Heidelberg, pp. 109--124. 2012.
ISBN: 978-3-642-23175-9
DOI: 10.1007/978-3-642-23175-9_8
Area-preserving maps arise in the study of conservative dynamical systems describing a wide variety of physical phenomena, from the rotation of planets to the dynamics of a fluid. The visual inspection of these maps reveals a remarkable topological picture in which invariant manifolds form the fractal geometric scaffold of both quasi-periodic and chaotic regions. We discuss in this paper the visualization of such maps built upon these invariant manifolds. This approach is in stark contrast with the discrete Poincare plots that are typically used for the visual inspection of maps. We propose to that end several modified definitions of the finite-time Lyapunov exponents that we apply to reveal the underlying structure of the dynamics. We examine the impact of various parameters and the numerical aspects that pertain to the implementation of this method. We apply our technique to a standard analytical example and to a numerical simulation of magnetic confinement in a fusion reactor. In both cases our simple method is able to reveal salient structures across spatial scales and to yield expressive images across application domains.
2011
![]()
X. Tricoche, C. Garth, A. Sanderson.
“Visualization of topological structures in area-preserving maps,” In IEEE Transactions on Visualization and Computer Graphics (TVCG), Vol. 17, No. 12, pp. 1765--1774. Dec, 2011.
DOI: 10.1109/TVCG.2011.254
PubMed ID: 22034293
2010
![]()
![]()
Allen R. Sanderson, Scott Kruger, and Stephane Either.
“Visualization and Analysis Tools for Assisting in Evaluating Fusion Simulations,” In Proceedings of the Sherwood Fusion Theory Conference, 2010.
![]()
A.R. Sanderson, G. Chen, X. Tricoche, D. Pugmire, S. Kruger, J. Breslau.
“Analysis of Recurrent Patterns in Toroidal Magnetic Fields,” In IEEE Transactions on Visualization and Computer Graphics, Vol. 16, No. 6, IEEE, pp. 1431-1440. Nov, 2010.
DOI: 10.1109/tvcg.2010.133
2009
![]()
E.W. Bethel, C.R. Johnson, S. Ahern, J. Bell, P.-T. Bremer, H. Childs, E. Cormier-Michel, M. Day, E. Deines, P.T. Fogal, C. Garth, C.G.R. Geddes, H. Hagen, B. Hamann, C.D. Hansen, J. Jacobsen, K.I. Joy, J. Krüger, J. Meredith, P. Messmer, G. Ostrouchov, V. Pascucci, K. Potter, Prabhat, D. Pugmire, O. Rubel, A.R. Sanderson, C.T. Silva, D. Ushizima, G.H. Weber, B. Whitlock, K. Wu.
“Occam's Razor and Petascale Visual Data Analysis,” In Journal of Physics: Conference Series, Journal of Physics: Conference Series, Vol. 180, No. 012084, pp. (published online). 2009.
DOI: 10.1088/1742-6596/180/1/012084
One of the central challenges facing visualization research is how to effectively enable knowledge discovery. An effective approach will likely combine application architectures that are capable of running on today's largest platforms to address the challenges posed by large data with visual data analysis techniques that help find, represent, and effectively convey scientifically interesting features and phenomena.
![]()
H.G. Martinez, S.I. Prajapati, C.A. Estrada, F. Jimenez, M.P. Quinones, I. Wu, A. Bahadur, A. Sanderson, C.R. Johnson, M. Shim, C. Keller, S.S. Ahuja.
“Microscopic Computed Tomography Based Virtual Histology for Visualization and Morphometry of Atherosclerosis in Diabetic Apolipoprotein E Mutant Mice,” In Circulation: Journal of the American Heart Association, Vol. 120, No. 9, pp. 821--822. 2009.
![]()
H. Martinez, S. Prajapati, C. Estrada, F. Jimenez, I. Wu, A. Bahadur, A. Sanderson, C.R. Johnson, M. Shim, C. Keller, S. Ahuja.
“Microscopic Computed Tomography–Based Virtual Histology for Visualization and Morphometry of Atherosclerosis in Diabetic Apolipoprotein E Mutant Mice,” In Circulation, Vol. 120, No. 821--822, 2009.
![]()
A.R. Sanderson, M.D. Meyer, R.M. Kirby, C.R. Johnson.
“A Framework for Exploring Numerical Solutions of Advection Reaction Diffusion Equations using a GPU Based Approach,” In Journal of Computing and Visualization in Science, Vol. 12, pp. 155--170. 2009.
DOI: 10.1007/s00791-008-0086-0
![]()
D. Sato, Y. Xie, J.N. Weiss, Z. Qu, A. Garfinkel, A.R. Sanderson.
“Acceleration of Cardiac Tissue Simulation with Graphic Processing Units,” In Medical and Biological Engineering and Computing, Note: Published online Aug 5, 2009, 2009.
DOI: 10.1007/s11517-0
2007
![]()
E.W. Bethel, C.R. Johnson, K. Joy, S. Ahern, V. Pascucci, H. Childs, J. Cohen, M. Duchaineau, B. Hamann, C.D. Hansen, D. Laney, P. Lindstrom, J. Meredith, G. Ostrouchov, S.G. Parker, C.T. Silva, A.R. Sanderson, X. Tricoche.
“SciDAC Visualization and Analytics Center for Enabling Technology,” In Journal of Physics, Conference Series, Vol. 78, No. 012032, pp. (published online). 2007.
E.W. Bethel, C.R. Johnson, C. Aragon, Prabhat, O. Rübel, G. Weber, V. Pascucci, H. Childs, P.-T. Bremer, B. Whitlock, S. Ahern, J. Meredith, G. Ostrouchov, K. Joy, B. Hamann, C. Garth, M. Cole, C.D. Hansen, S.G. Parker, A.R. Sanderson, C.T. Silva, X. Tricoche.
“DOE's SciDAC Visualization and Analytics Center for Enabling Technologies - Strategy for Petascale Visual Data Analysis Success,” In CTWatch Quarterly, Vol. 3, No. 4, 2007.
![]()
C. Jones, K.-L. Ma, A.R. Sanderson, L. Myers.
“Visual Interrogation of Gyrokinetic Particle Simulations,” In Journal of Physics, Conference Series, Vol. 78, pp. 012033 (6pp). 2007.
Page 1 of 2