
SCI Publications
2013
![]()
![]()
N. Sadeghi, C. Vachet, M. Prastawa, J. Korenberg, G. Gerig.
“Analysis of Diffusion Tensor Imaging for Subjects with Down Syndrome,” In Proceedings of the 19th Annual Meeting of the Organization for Human Brain Mapping OHBM, pp. (in print). 2013.
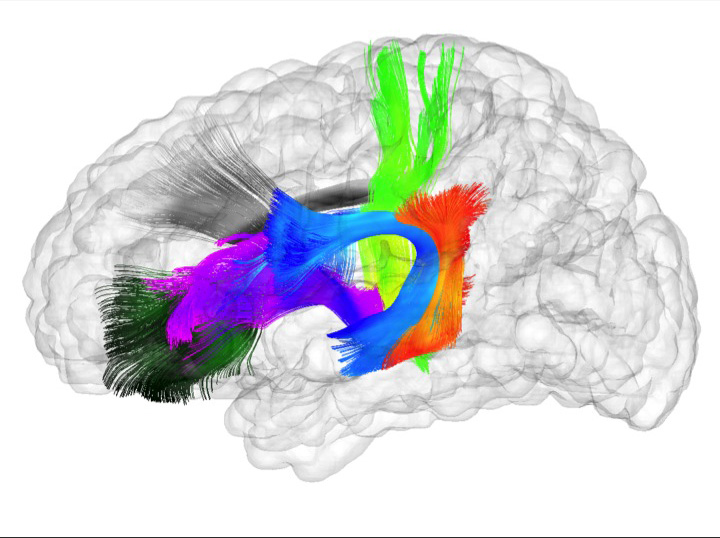
Down syndrome (DS) is the most common chromosome abnormality in humans. It is typically associated with delayed cognitive development and physical growth. DS is also associated with Alzheimer-like dementia [1]. In this study we analyze the white matter integrity of individuals with DS compared to control as is reflected in the diffusion parameters derived from Diffusion Tensor Imaging. DTI provides relevant information about the underlying tissue, which correlates with cognitive function [2]. We present a cross-sectional analysis of white matter tracts of subjects with DS compared to control.
![]()
N. Sadeghi.
“Modeling and Analysis of Longitudinal Multimodal Magnetic Resonance Imaging: Application to Early Brain Development,” Note: Ph.D. Thesis, Department of Bioengineering, University of Utah, December, 2013.
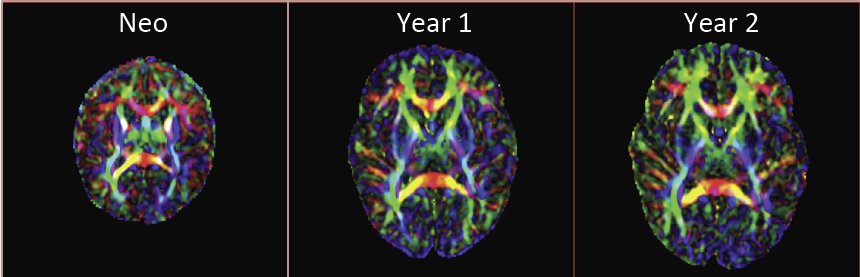
Many mental illnesses are thought to have their origins in early stages of development, encouraging increased research efforts related to early neurodevelopment. Magnetic resonance imaging (MRI) has provided us with an unprecedented view of the brain in vivo. More recently, diffusion tensor imaging (DTI/DT-MRI), a magnetic resonance imaging technique, has enabled the characterization of the microstrucutral organization of tissue in vivo. As the brain develops, the water content in the brain decreases while protein and fat content increases due to processes such as myelination and axonal organization. Changes of signal intensity in structural MRI and diffusion parameters of DTI reflect these underlying biological changes.
Longitudinal neuroimaging studies provide a unique opportunity for understanding brain maturation by taking repeated scans over a time course within individuals. Despite the availability of detailed images of the brain, there has been little progress in accurate modeling of brain development or creating predictive models of structure that could help identify early signs of illness. We have developed methodologies for the nonlinear parametric modeling of longitudinal structural MRI and DTI changes over the neurodevelopmental period to address this gap. This research provides a normative model of early brain growth trajectory as is represented in structural MRI and DTI data, which will be crucial to understanding the timing and potential mechanisms of atypical development. Growth trajectories are described via intuitive parameters related to delay, rate of growth and expected asymptotic values, all descriptive measures that can answer clinical questions related to quantitative analysis of growth patterns. We demonstrate the potential of the framework on two clinical studies: healthy controls (singletons and twins) and children at risk of autism. Our framework is designed not only to provide qualitative comparisons, but also to give researchers and clinicians quantitative parameters and a statistical testing scheme. Moreover, the method includes modeling of growth trajectories of individuals, resulting in personalized profiles. The statistical framework also allows for prediction and prediction intervals for subject-specific growth trajectories, which will be crucial for efforts to improve diagnosis for individuals and personalized treatment.
Keywords: autism, brain development, image analysis
![]()
S. Short, J.T. Elison, B.D. Goldman, M. Styner, H. Gu, M. Connelly, E. Maltbie, S. Woolson, W. Lin, G. Gerig, J.S. Reznick, J.H. Gilmore.
“Associations Between White Matter Microstructure and Infants' Working Memory,” In Neuroimage, Vol. 64, No. 1, Elsvier, pp. 156--166. January, 2013.
DOI: 10.1016/j.neuroimage.2012.09.021
PubMed ID: 22989623
2012
![]()
C. Cascio, M.J. Gribbin, S. Gouttard, R.G. Smith, M. Jomier, S.H. Field, M. Graves, H.C. Hazlett, K. Muller, G. Gerig, J. Piven.
“Fractional Anisotropy Distributions in 2-6 Year-Old Children with Autism,” In Journal of Intellectual Disability Research (JIDR), pp. (in print). 2012.
Background: Increasing evidence suggests that autism is a disorder of distributed neural networks that may exhibit abnormal developmental trajectories. Characterization of white matter early in the developmental course of the disorder is critical to understanding these aberrant trajectories.
Methods: A cross-sectional study of 2-6 year old children with autism was conducted using diffusion tensor imaging combined with a novel statistical approach employing fractional anisotropy distributions. 58 children aged 18-79 months were imaged: 33 were diagnosed with autism, 8 with general developmental delay (DD), and 17 were typically developing (TD). Fractional anisotropy values within global white matter, cortical lobes, and the cerebellum were measured and transformed to random F distributions for each subject. Each distribution of values for a region was summarized by estimating delta, the estimated mean and standard deviation of the approximating F for each distribution.
Results: The estimated delta parameter, delta-hat, was significantly decreased in individuals with autism compared to the combined control group. This was true in all cortical lobes, as well as in the cerebellum, but differences were strongest in the temporal lobe. Predicted developmental trajectories of delta-hat across the age range in the sample showed patterns that partially distinguished the groups. Exploratory analyses suggested that the variability, rather than the central tendency, component of delta-hat was the driving force behind these results. Conclusions: White matter in young children with autism appears to be abnormally homogeneous, which may reflect poorly organized or differentiated pathways, particularly in the temporal lobe, which is important for social and emotional cognition.
![]()
S. Gouttard, C.B. Goodlett, M. Kubicki, G. Gerig.
“Measures for Validation of DTI Tractography,” In Medical Imaging 2012: Image Processing, Edited by David R. Haynor and Sebastien Ourselin, SPIE Intl Soc Optical Eng, Feb, 2012.
DOI: 10.1117/12.911546
![]()
A. Gupta, M. Escolar, C. Dietrich, J. Gilmore, G. Gerig, M. Styne.
“3D Tensor Normalization for Improved Accuracy in DTI Registration Methods,” In Biomedical Image Registration Lecture Notes in Computer Science (LNCS), In Biomedical Image Registration Lecture Notes in Computer Science (LNCS), Vol. 7359, pp. 170--179. 2012.
DOI: 10.1007/978-3-642-31340-0_18
This paper presents a method for normalization of diffusion tensor images (DTI) to a fixed DTI template, a pre-processing step to improve the performance of full tensor based registration methods. The proposed method maps the individual tensors of the subject image in to the template space based on matching the cumulative distribution function and the fractional anisotrophy values. The method aims to determine a more accurate deformation field from any full tensor registration method by applying the registration algorithm on the normalized DTI rather than the original DTI. The deformation field applied to the original tensor images are compared to the deformed image without normalization for 11 different cases of mapping seven subjects (neonate through 2 years) to two different atlases. The method shows an improvement in DTI registration based on comparing the normalized fractional anisotropy values of major fiber tracts in the brain.
![]()
A. Irimia, Bo Wang, S.R. Aylward, M.W. Prastawa, D.F. Pace, G. Gerig, D.A. Hovda, R.Kikinis, P.M. Vespa, J.D. Van Horn.
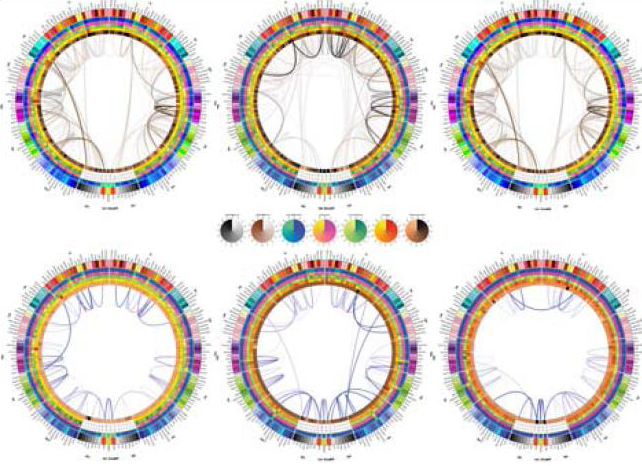
“Neuroimaging of Structural Pathology and Connectomics in Traumatic Brain Injury: Toward Personalized Outcome Prediction,” In NeuroImage: Clinical, Vol. 1, No. 1, Elsvier, pp. 1--17. 2012.
DOI: 10.1016/j.nicl.2012.08.002
![]()
C.R. Johnson.
“Biomedical Visual Computing: Case Studies and Challenges,” In IEEE Computing in Science and Engineering, Vol. 14, No. 1, pp. 12--21. 2012.
PubMed ID: 22545005
PubMed Central ID: PMC3336198
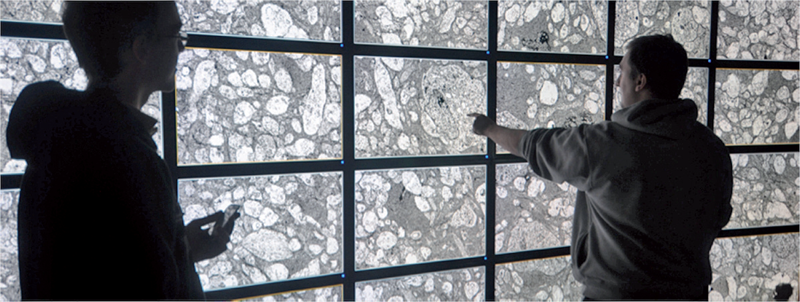
Computer simulation and visualization are having a substantial impact on biomedicine and other areas of science and engineering. Advanced simulation and data acquisition techniques allow biomedical researchers to investigate increasingly sophisticated biological function and structure. A continuing trend in all computational science and engineering applications is the increasing size of resulting datasets. This trend is also evident in data acquisition, especially in image acquisition in biology and medical image databases.
For example, in a collaboration between neuroscientist Robert Marc and our research team at the University of Utah's Scientific Computing and Imaging (SCI) Institute (www.sci.utah.edu), we're creating datasets of brain electron microscopy (EM) mosaics that are 16 terabytes in size. However, while there's no foreseeable end to the increase in our ability to produce simulation data or record observational data, our ability to use this data in meaningful ways is inhibited by current data analysis capabilities, which already lag far behind. Indeed, as the NIH-NSF Visualization Research Challenges report notes, to effectively understand and make use of the vast amounts of data researchers are producing is one of the greatest scientific challenges of the 21st century.
Visual data analysis involves creating images that convey salient information about underlying data and processes, enabling the detection and validation of expected results while leading to unexpected discoveries in science. This allows for the validation of new theoretical models, provides comparison between models and datasets, enables quantitative and qualitative querying, improves interpretation of data, and facilitates decision making. Scientists can use visual data analysis systems to explore \"what if\" scenarios, define hypotheses, and examine data under multiple perspectives and assumptions. In addition, they can identify connections between numerous attributes and quantitatively assess the reliability of hypotheses. In essence, visual data analysis is an integral part of scientific problem solving and discovery.
As applied to biomedical systems, visualization plays a crucial role in our ability to comprehend large and complex data-data that, in two, three, or more dimensions, convey insight into many diverse biomedical applications, including understanding neural connectivity within the brain, interpreting bioelectric currents within the heart, characterizing white-matter tracts by diffusion tensor imaging, and understanding morphology differences among different genetic mice phenotypes.
Keywords: kaust
![]()
N. Sadeghi, M.W. Prastawa, P.T. Fletcher, J.H. Gilmore, W. Lin, G. Gerig.
“Statistical Growth Modeling of Longitudinal DT-MRI for Regional Characterization of Early Brain Development,” In Proceedings of IEEE ISBI 2012, pp. 1507--1510. 2012.
DOI: 10.1109/ISBI.2012.6235858
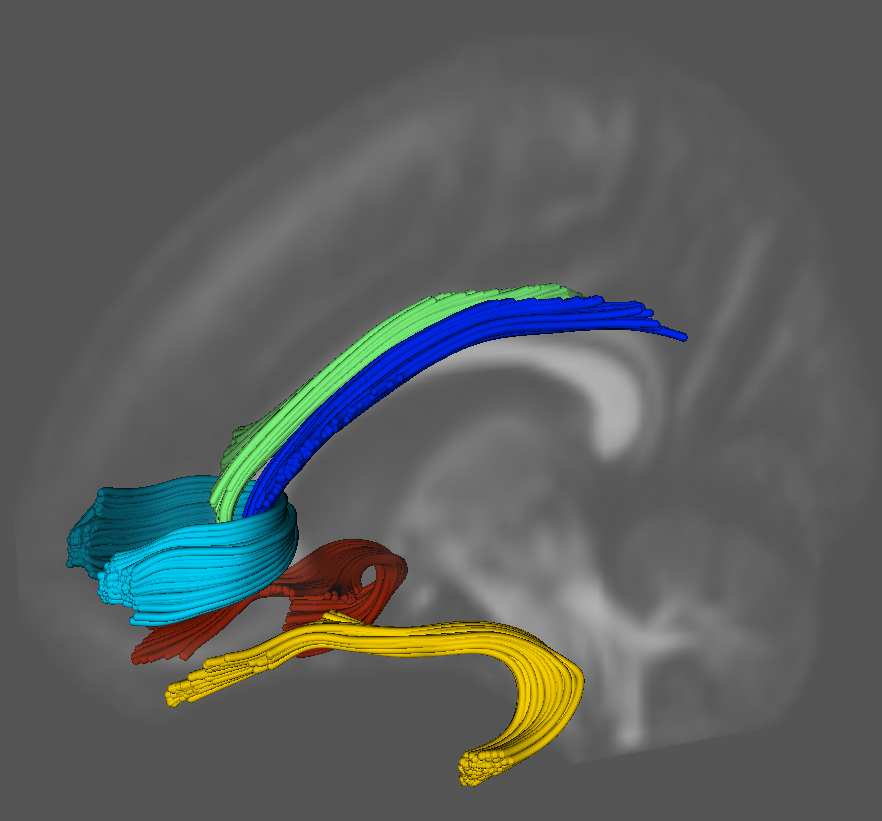
A population growth model that represents the growth trajectories of individual subjects is critical to study and understand neurodevelopment. This paper presents a framework for jointly estimating and modeling individual and population growth trajectories, and determining significant regional differences in growth pattern characteristics applied to longitudinal neuroimaging data. We use non-linear mixed effect modeling where temporal change is modeled by the Gompertz function. The Gompertz function uses intuitive parameters related to delay, rate of change, and expected asymptotic value; all descriptive measures which can answer clinical questions related to growth. Our proposed framework combines nonlinear modeling of individual trajectories, population analysis, and testing for regional differences. We apply this framework to the study of early maturation in white matter regions as measured with diffusion tensor imaging (DTI). Regional differences between anatomical regions of interest that are known to mature differently are analyzed and quantified. Experiments with image data from a large ongoing clinical study show that our framework provides descriptive, quantitative information on growth trajectories that can be directly interpreted by clinicians. To our knowledge, this is the first longitudinal analysis of growth functions to explain the trajectory of early brain maturation as it is represented in DTI.
![]()
![]()
J.J. Wolff, H. Gu, G. Gerig, J.T. Elison, M. Styner, S. Gouttard, K.N. Botteron, S.R. Dager, G. Dawson, A.M. Estes, A. Evans, H.C. Hazlett, P. Kostopoulos, R.C. McKinstry, S.J. Paterson, R.T. Schultz, L. Zwaigenbaum, J. Piven.
“Differences in White Matter Fiber Tract Development Present from 6 to 24 Months in Infants with Autism,” In American Journal of Psychiatry (AJP), Note: Selected as an AJP Best of 2012 paper., pp. 1--12. 2012.
DOI: 10.1176/appi.ajp.2011.11091447
Objective: Evidence from prospective studies of high-risk infants suggests that early symptoms of autism usually emerge late in the first or early in the second year of life after a period of relatively typical development. The authors prospectively examined white matter fiber tract organization from 6 to 24 months in high-risk infants who developed autism spectrum disorders (ASDs) by 24 months.
Method: The participants were 92 highrisk infant siblings from an ongoing imaging study of autism. All participants had diffusion tensor imaging at 6 months and behavioral assessments at 24 months; a majority contributed additional imaging data at 12 and/or 24 months. At 24 months, 28 infants met criteria for ASDs and 64 infants did not. Microstructural properties of white matter fiber tracts reported to be associated with ASDs or related behaviors were characterized by fractional anisotropy and radial and axial diffusivity.
Results: The fractional anisotropy trajectories for 12 of 15 fiber tracts differed significantly between the infants who developed ASDs and those who did not. Development for most fiber tracts in the infants with ASDs was characterized by higher fractional anisotropy values at 6 months followed by slower change over time relative to infants without ASDs. Thus, by 24 months of age, those with ASDs had lower values.
Conclusions: These results suggest that aberrant development of white matter pathways may precede the manifestation of autistic symptoms in the first year of life. Longitudinal data are critical to characterizing the dynamic age-related brain and behavior changes underlying this neurodevelopmental disorder.
2011
![]()
N. Sadeghi, M.W. Prastawa, P.T. Fletcher, J.H. Gilmore, W. Lin, G. Gerig.
“Statistical Growth Modeling of Longitudinal DT-MRI for Regional Characterization of Early Brain Development,” In Proceedings of the Medical Image Computing and Computer Assisted Intervention (MICCAI) 2011 Workshop on Image Analysis of Human Brain Development, pp. 1507--1510. 2011.
DOI: 10.1109/ISBI.2012.6235858
A population growth model that represents the growth trajectories of individual subjects is critical to study and understand neurodevelopment. This paper presents a framework for jointly estimating and modeling individual and population growth trajectories, and determining significant regional differences in growth pattern characteristics applied to longitudinal neuroimaging data. We use non-linear mixed effect modeling where temporal change is modeled by the Gompertz function. The Gompertz function uses intuitive parameters related to delay, rate of change, and expected asymptotic value; all descriptive measures which can answer clinical questions related to growth. Our proposed framework combines nonlinear modeling of individual trajectories, population analysis, and testing for regional differences. We apply this framework to the study of early maturation in white matter regions as measured with diffusion tensor imaging (DTI). Regional differences between anatomical regions of interest that are known to mature differently are analyzed and quantified. Experiments with image data from a large ongoing clinical study show that our framework provides descriptive, quantitative information on growth trajectories that can be directly interpreted by clinicians. To our knowledge, this is the first longitudinal analysis of growth functions to explain the trajectory of early brain maturation as it is represented in DTI.
Keywords: namic
![]()
R. Samuel, H.J. Sant, F. Jiao, C.R. Johnson, B.K. Gale.
“Microfluidic laminate-based phantom for diffusion tensor-magnetic resonance imaging,” In Journal of Micromech. Microeng., Vol. 21, pp. 095027--095038. 2011.
DOI: 10.1088/0960-1317/21/9/095027
![]()
H. Zhu, L. Kong, R. Li, M.S. Styner, G. Gerig, W. Lin, J.H. Gilmore.
“FADTTS: Functional Analysis of Diffusion Tensor Tract Statistics,” In NeuroImage, Vol. 56, No. 3, pp. 1412--1425. 2011.
DOI: 10.1016/j.neuroimage.2011.01.075
PubMed ID: 21335092
2010
![]()
A. Chaturvedi, C.R. Butson, S.F. Lempka, S.E. Cooper, C.C. McIntyre.
“Patient-specific models of deep brain stimulation: influence of field model complexity on neural activation predictions,” In Brain Stimulation, Vol. 3, No. 2, Elsevier Inc., pp. 65--67. April, 2010.
ISSN: 1935-861X
DOI: 10.1016/j.brs.2010.01.003
PubMed ID: 20607090
Keywords: Action Potentials, Action Potentials: physiology, Computer Simulation, Deep Brain Stimulation, Deep Brain Stimulation: instrumentation, Deep Brain Stimulation: methods, Humans, Male, Middle Aged, Models, Neurological, Parkinson Disease, Parkinson Disease: therapy, Subthalamic Nucleus, Subthalamic Nucleus: physiology
![]()
F. Jiao, J.M. Phillips, J.G. Stinstra, J. Kueger, R. Varma, E. Hsu, J. Korenberg, C.R. Johnson.
“Metrics for Uncertainty Analysis and Visualization of Diffusion Tensor Images,” In Proceedings of the 5th international conference on Medical imaging and augmented reality (MIAR), Beijing, China, Springer-Verlag, Berlin, Heidelberg pp. 179--190. September, 2010.
![]()
N. Lange, M.B. Dubray, J.E. Lee, M.P. Froimowitz, A. Froehlich, N. Adluru, B. Wright, C. Ravichandran, P.T. Fletcher, E.D. Bigler, A.L. Alexander, J.E. Lainhart.
“Atypical diffusion tensor hemispheric asymmetry in autism,” In Autism Research, Vol. 3, No. 6, pp. 350--358. 2010.
DOI: 10.1002/aur.162
PubMed ID: 21182212
2009
![]()
C. Goodlett, P.T. Fletcher, J.H. Gilmore, G. Gerig.
“Group Analysis of DTI Fiber Tract Statistics with Application to Neurodevelopment,” In NeuroImage, Vol. 45, pp. S133--S142. December, 2009.
DOI: 10.1016/j.neuroimage.2008.10.060
PubMed ID: 19059345
PubMed Central ID: PMC2727755
Diffusion tensor imaging (DTI) provides a unique source of information about the underlying tissue structure of brain white matter in vivo including both the geometry of major fiber bundles as well as quantitative information about tissue properties represented by derived tensor measures. This paper presents a method for statistical comparison of fiber bundle diffusion properties between populations of diffusion tensor images. Unbiased diffeomorphic atlas building is used to compute a normalized coordinate system for populations of diffusion images. The diffeomorphic transformations between each subject and the atlas provide spatial normalization for the comparison of tract statistics. Diffusion properties, such as fractional anisotropy (FA) and tensor norm, along fiber tracts are modeled as multivariate functions of arc length. Hypothesis testing is performed non-parametrically using permutation testing based on the Hotelling T(2) statistic. The linear discriminant embedded in the T(2) metric provides an intuitive, localized interpretation of detected differences. The proposed methodology was tested on two clinical studies of neurodevelopment. In a study of 1 and 2 year old subjects, a significant increase in FA and a correlated decrease in Frobenius norm was found in several tracts. Significant differences in neonates were found in the splenium tract between controls and subjects with isolated mild ventriculomegaly (MVM) demonstrating the potential of this method for clinical studies.
![]()
C.B. Maks, C.R. Butson, B.L. Walter, J.L. Vitek, C.C. McIntyre.
“Deep brain stimulation activation volumes and their association with neurophysiological mapping and therapeutic outcomes,” In Journal of Neurology, Neurosurgery, and Psychiatry, Vol. 80, No. 6, pp. 659--666. June, 2009.
ISSN: 1468-330X
DOI: 10.1136/jnnp.2007.126219
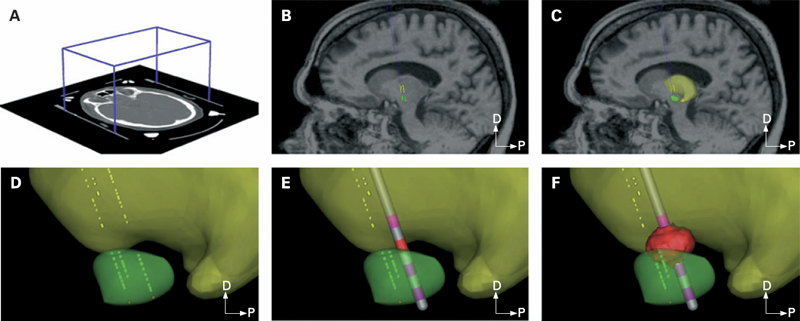
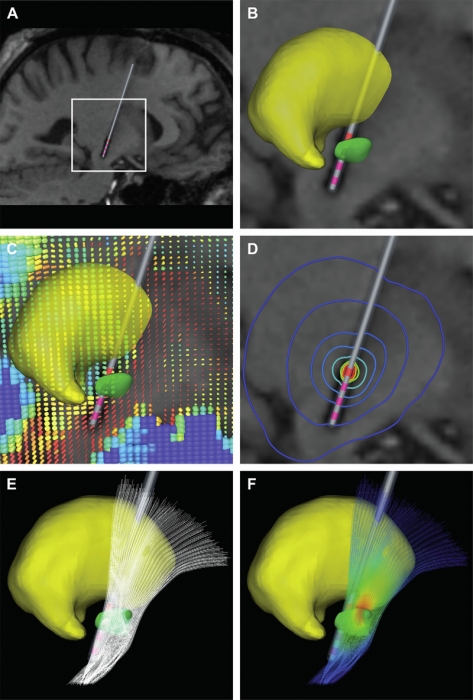
METHODS: Each patient specific model was created with a series of five steps: (1) definition of the neurosurgical stereotactic coordinate system within the context of preoperative imaging data; (2) entry of intraoperative microelectrode recording locations from neurophysiologically defined thalamic, subthalamic and substantia nigra neurons into the context of the imaging data; (3) fitting a three dimensional brain atlas to the neuroanatomy and neurophysiology of the patient; (4) positioning the DBS electrode in the documented stereotactic location, verified by postoperative imaging data; and (5) calculation of the VTA using a diffusion tensor based finite element neurostimulation model.
RESULTS: The patient specific models show that therapeutic benefit was achieved with direct stimulation of a wide range of anatomical structures in the subthalamic region. Interestingly, of the five patients exhibiting a greater than 40\% improvement in their Unified PD Rating Scale (UPDRS), all but one had the majority of their VTA outside the atlas defined borders of the STN. Furthermore, of the five patients with less than 40\% UPDRS improvement, all but one had the majority of their VTA inside the STN.
CONCLUSIONS: Our results are consistent with previous studies suggesting that therapeutic benefit is associated with electrode contacts near the dorsal border of the STN, and provide quantitative estimates of the electrical spread of the stimulation in a clinically relevant context.
Keywords: Brain Mapping, Brain Mapping: methods, Cerebral,Cerebral: physiology, Computer-Assisted, Computer-Assisted: methods, Deep Brain Stimulation, Deep Brain Stimulation: methods, Diffusion Magnetic Resonance Imaging, Diffusion Magnetic Resonance Imaging: methods, Dominance, Electrodes, Humans, Image Processing, Imaging, Implanted, Magnetic Resonance Imaging, Magnetic Resonance Imaging: methods, Nerve Net, Nerve Net: physiopathology, Neurologic Examination, Neurons, Neurons: physiology, Parkinson Disease, Parkinson Disease: physiopathology, Parkinson Disease: therapy, Substantia Nigra, Substantia Nigra: physiopathology, Subthalamic Nucleus, Subthalamic Nucleus: physiopathology, Synaptic Transmission, Synaptic Transmission: physiology, Thalamus, Thalamus: physiopathology, Three-Dimensional, Tomography, Treatment Outcome, X-Ray Computed, X-Ray Computed: methods
2008
![]()
C.R. Johnson, X. Tricoche.
“Biomedical Visualization,” In Advances in Biomedical Engineering, Ch. 6, Edited by Pascal Verdonck, Elsvier Science, pp. 209--272. 2008.
2007
![]()
G. Adluru, E. Hsu, E.V.R. DiBella.
“Constrained Reconstruction of Sparse Cardiac MR DTI Data,” In Proceedings of FIMH 2007, LNCS, No. 4466, pp. 91--99. 2007.
Page 2 of 4