
SCI Publications
2017
![]()
M. Rautenhaus, M. Böttinger, S. Siemen, R. Hoffman, R.M. Kirby, M. Mirzargar, N. Rober, R. Westermann.
“Visualization in Meteorology---A Survey of Techniques and Tools for Data Analysis Tasks,” In IEEE Transactions on Visualization and Computer Graphics, IEEE, pp. 1--1. 2017.
DOI: 10.1109/tvcg.2017.2779501
This article surveys the history and current state of the art of visualization in meteorology, focusing on visualization techniques and tools used for meteorological data analysis. We examine characteristics of meteorological data and analysis tasks, describe the development of computer graphics methods for visualization in meteorology from the 1960s to today, and visit the state of the art of visualization techniques and tools in operational weather forecasting and atmospheric research. We approach the topic from both the visualization and the meteorological side, showing visualization techniques commonly used in meteorological practice, and surveying recent studies in visualization research aimed at meteorological applications. Our overview covers visualization techniques from the fields of display design, 3D visualization, flow dynamics, feature-based visualization, comparative visualization and data fusion, uncertainty and ensemble visualization, interactive visual analysis, efficient rendering, and scalability and reproducibility. We discuss demands and challenges for visualization research targeting meteorological data analysis, highlighting aspects in demonstration of benefit, interactive visual analysis, seamless visualization, ensemble visualization, 3D visualization, and technical issues.
2015
![]()
T. Etiene, R.M. Kirby, C. Silva.
“An Introduction to Verification of Visualization Techniques,” Morgan & Claypool Publishers, 2015.
![]()
C. Gritton, M. Berzins, R. M. Kirby.
“Improving Accuracy In Particle Methods Using Null Spaces and Filters,” In Proceedings of the IV International Conference on Particle-Based Methods - Fundamentals and Applications, Barcelona, Spain, Edited by E. Onate and M. Bischoff and D.R.J. Owen and P. Wriggers and T. Zohdi, CIMNE, pp. 202-213. September, 2015.
ISBN: 978-84-944244-7-2
While particle-in-cell type methods, such as MPM, have been very successful in providing solutions to many challenging problems there are some important issues that remain to be resolved with regard to their analysis. One such challenge relates to the difference in dimensionality between the particles and the grid points to which they are mapped. There exists a non-trivial null space of the linear operator that maps particles values onto nodal values. In other words, there are non-zero particle values values that when mapped to the nodes are zero there. Given positive mapping weights such null space values are oscillatory in nature. The null space may be viewed as a more general form of the ringing instability identified by Brackbill for PIC methods. It will be shown that it is possible to remove these null-space values from the solution and so to improve the accuracy of PIC methods, using a matrix SVD approach. The expense of doing this is prohibitive for real problems and so a local method is developed for doing this.
R.M. Kirby, M. Berzins, J.S. Hesthaven (Editors).
“Spectral and High Order Methods for Partial Differential Equations,” Subtitled “Selected Papers from the ICOSAHOM'14 Conference, June 23-27, 2014, Salt Lake City, UT, USA.,” In Lecture Notes in Computational Science and Engineering, Springer, 2015.
2014
![]()
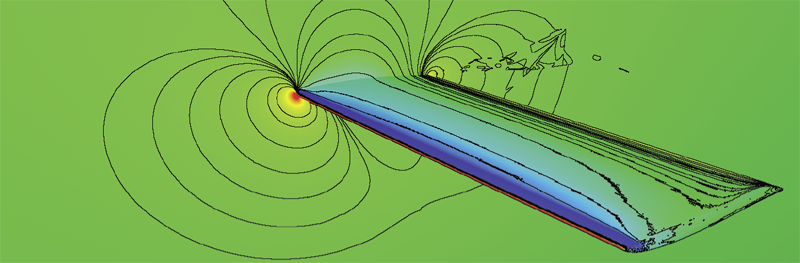
H. Bhatia, V. Pascucci, R.M. Kirby, P.-T. Bremer.
“Extracting Features from Time-Dependent Vector Fields Using Internal Reference Frames,” In Computer Graphics Forum, Vol. 33, No. 3, pp. 21--30. June, 2014.
DOI: 10.1111/cgf.12358
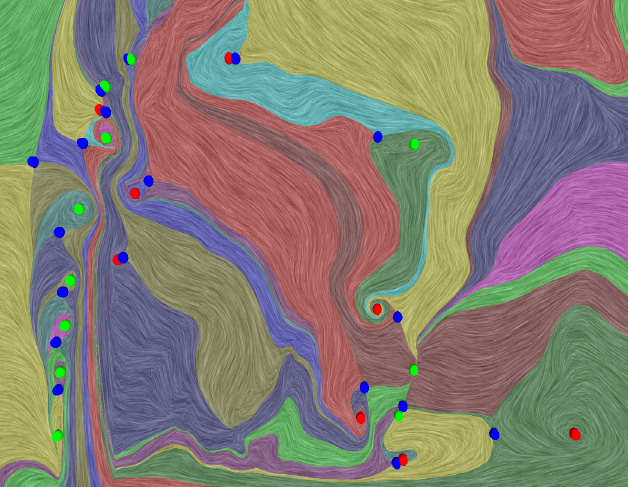
This paper introduces a new data-driven technique to compute internal reference frames for large-scale complex flows. More general than uniformly moving frames, these frames can transform unsteady fields, which otherwise require substantial processing of resources, into a sequence of individual snapshots that can be analyzed using the large body of steady-flow analysis techniques. Our approach is simple, theoretically well-founded, and uses an embarrassingly parallel algorithm for structured as well as unstructured data. Using several case studies from fluid flow and turbulent combustion, we demonstrate that internal frames are distinguished, result in temporally coherent structures, and can extract well-known as well as notoriously elusive features one snapshot at a time.
![]()
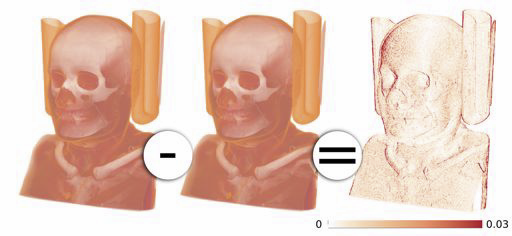
T. Etiene, D. Jonsson, T. Ropinski, C. Scheidegger, J.L.D. Comba, L. G. Nonato, R. M. Kirby, A. Ynnerman,, C. T. Silva.
“Verifying Volume Rendering Using Discretization Error Analysis,” In IEEE TRANSACTIONS ON VISUALIZATION AND COMPUTER GRAPHICS, Vol. 20, No. 1, IEEE, pp. 140-154. January, 2014.
We propose an approach for verification of volume rendering correctness based on an analysis of the volume rendering integral, the basis of most DVR algorithms. With respect to the most common discretization of this continuous model (Riemann summation), we make assumptions about the impact of parameter changes on the rendered results and derive convergence curves describing the expected behavior. Specifically, we progressively refine the number of samples along the ray, the grid size, and the pixel size, and evaluate how the errors observed during refinement compare against the expected approximation errors. We derive the theoretical foundations of our verification approach, explain how to realize it in practice, and discuss its limitations. We also report the errors identified by our approach when applied to two publicly available volume rendering packages.
![]()
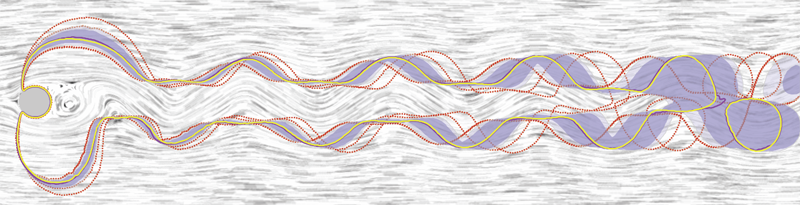
M. Mirzargar, R. Whitaker, R. M. Kirby.
“Curve Boxplot: Generalization of Boxplot for Ensembles of Curves,” In IEEE Transactions on Visualization and Computer Graphics, Vol. 20, No. 12, IEEE, pp. 2654-63. December, 2014.
In simulation science, computational scientists often study the behavior of their simulations by repeated solutions with variations in parameters and/or boundary values or initial conditions. Through such simulation ensembles, one can try to understand or quantify the variability or uncertainty in a solution as a function of the various inputs or model assumptions. In response to a growing interest in simulation ensembles, the visualization community has developed a suite of methods for allowing users to observe and understand the properties of these ensembles in an efficient and effective manner. An important aspect of visualizing simulations is the analysis of derived features, often represented as points, surfaces, or curves. In this paper, we present a novel, nonparametric method for summarizing ensembles of 2D and 3D curves. We propose an extension of a method from descriptive statistics, data depth, to curves. We also demonstrate a set of rendering and visualization strategies for showing rank statistics of an ensemble of curves, which is a generalization of traditional whisker plots or boxplots to multidimensional curves. Results are presented for applications in neuroimaging, hurricane forecasting and fluid dynamics
2013
![]()
T. Etiene, D. Jonsson, T. Ropinski, C. Scheidegger, J. Comba, L. Gustavo Nonato, R.M. Kirby, A. Ynnerman, C.T. Silva.
“Verifying Volume Rendering Using Discretization Error Analysis,” SCI Technical Report, No. UUSCI-2013-001, SCI Institute, University of Utah, 2013.
Keywords: discretization errors, volume rendering, verifiable visualization
![]()
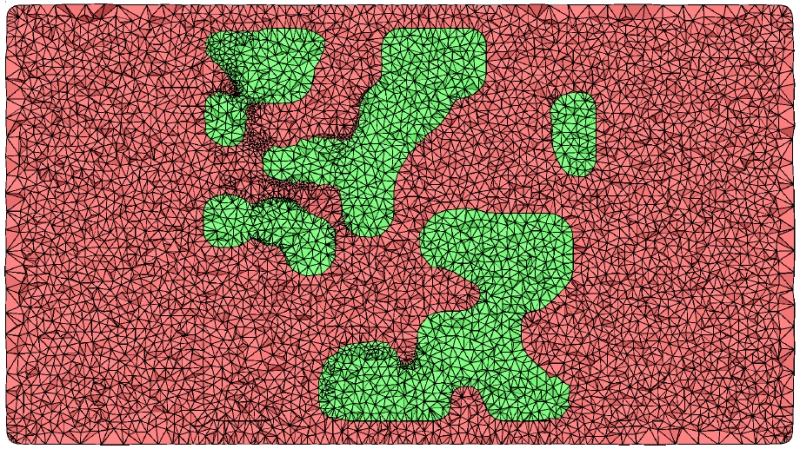
Z. Fu, R.M. Kirby, R.T. Whitaker.
“A Fast Iterative Method for Solving the Eikonal Equation on Tetrahedral Domains,” In SIAM Journal on Scientific Computing, Vol. 35, No. 5, pp. C473--C494. 2013.
![]()
L.K. Ha, J. King, Z. Fu, R.M. Kirby.
“A High-Performance Multi-Element Processing Framework on GPUs,” SCI Technical Report, No. UUSCI-2013-005, SCI Institute, University of Utah, 2013.
Many computational engineering problems ranging from finite element methods to image processing involve the batch processing on a large number of data items. While multielement processing has the potential to harness computational power of parallel systems, current techniques often concentrate on maximizing elemental performance. Frameworks that take this greedy optimization approach often fail to extract the maximum processing power of the system for multi-element processing problems. By ultilizing the knowledge that the same operation will be accomplished on a large number of items, we can organize the computation to maximize the computational throughput available in parallel streaming hardware. In this paper, we analyzed weaknesses of existing methods and we proposed efficient parallel programming patterns implemented in a high performance multi-element processing framework to harness the processing power of GPUs. Our approach is capable of levering out the performance curve even on the range of small element size.
![]()
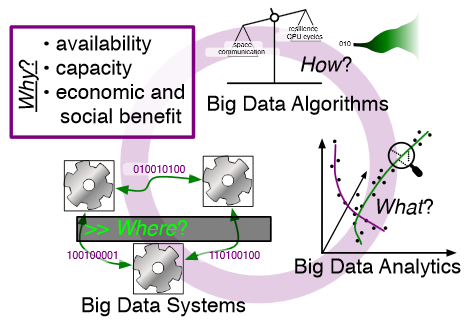
M. Hall, R.M. Kirby, F. Li, M.D. Meyer, V. Pascucci, J.M. Phillips, R. Ricci, J. Van der Merwe, S. Venkatasubramanian.
“Rethinking Abstractions for Big Data: Why, Where, How, and What,” In Cornell University Library, 2013.
Big data refers to large and complex data sets that, under existing approaches, exceed the capacity and capability of current compute platforms, systems software, analytical tools and human understanding [7]. Numerous lessons on the scalability of big data can already be found in asymptotic analysis of algorithms and from the high-performance computing (HPC) and applications communities. However, scale is only one aspect of current big data trends; fundamentally, current and emerging problems in big data are a result of unprecedented complexity |in the structure of the data and how to analyze it, in dealing with unreliability and redundancy, in addressing the human factors of comprehending complex data sets, in formulating meaningful analyses, and in managing the dense, power-hungry data centers that house big data.
The computer science solution to complexity is finding the right abstractions, those that hide as much triviality as possible while revealing the essence of the problem that is being addressed. The "big data challenge" has disrupted computer science by stressing to the very limits the familiar abstractions which define the relevant subfields in data analysis, data management and the underlying parallel systems. Efficient processing of big data has shifted systems towards increasingly heterogeneous and specialized units, with resilience and energy becoming important considerations. The design and analysis of algorithms must now incorporate emerging costs in communicating data driven by IO costs, distributed data, and the growing energy cost of these operations. Data analysis representations as structural patterns and visualizations surpass human visual bandwidth, structures studied at small scale are rare at large scale, and large-scale high-dimensional phenomena cannot be reproduced at small scale.
As a result, not enough of these challenges are revealed by isolating abstractions in a traditional soft-ware stack or standard algorithmic and analytical techniques, and attempts to address complexity either oversimplify or require low-level management of details. The authors believe that the abstractions for big data need to be rethought, and this reorganization needs to evolve and be sustained through continued cross-disciplinary collaboration.
In what follows, we first consider the question of why big data and why now. We then describe the where (big data systems), the how (big data algorithms), and the what (big data analytics) challenges that we believe are central and must be addressed as the research community develops these new abstractions. We equate the biggest challenges that span these areas of big data with big mythological creatures, namely cyclops, that should be conquered.
![]()
R.M. Kirby, M.D. Meyer.
“Visualization Collaborations: What Works and Why,” In IEEE Computer Graphics and Applications: Visualization Viewpoints, Vol. 33, No. 6, pp. 82--88. 2013.
Of particular interest to us is their vision for collaboration. McCormick and his colleagues envisioned an interdisciplinary team that through close interaction would develop visualization tools that not only were effective in the context of their immediate collaborative environment but also could be reused by scientists and engineers in other fields. McCormick and his colleagues categorized the types of researchers they imagined constituting these teams, one type being the "visualization scientist/engineer." They even commented on the skills these individuals might have. However, they provided little guidance on how to make such teams successful.
In the more than 25 years since the report, researchers have refined the concepts of interaction versus collaboration,3 interdisciplinary versus multidisciplinary teams,4,5 and independence versus interdependence.6 Here, we use observations from our collective 18 years of collaborative visualization research to help shed light on not just the composition of current and future visualization collaborative teams but also pitfalls and recommendations for successful collaboration. Although our statements might reflect what seasoned visualization researchers are already doing, we believe that reexpressing and possibly reaffirming basic collaboration principles provide benefits.
![]()
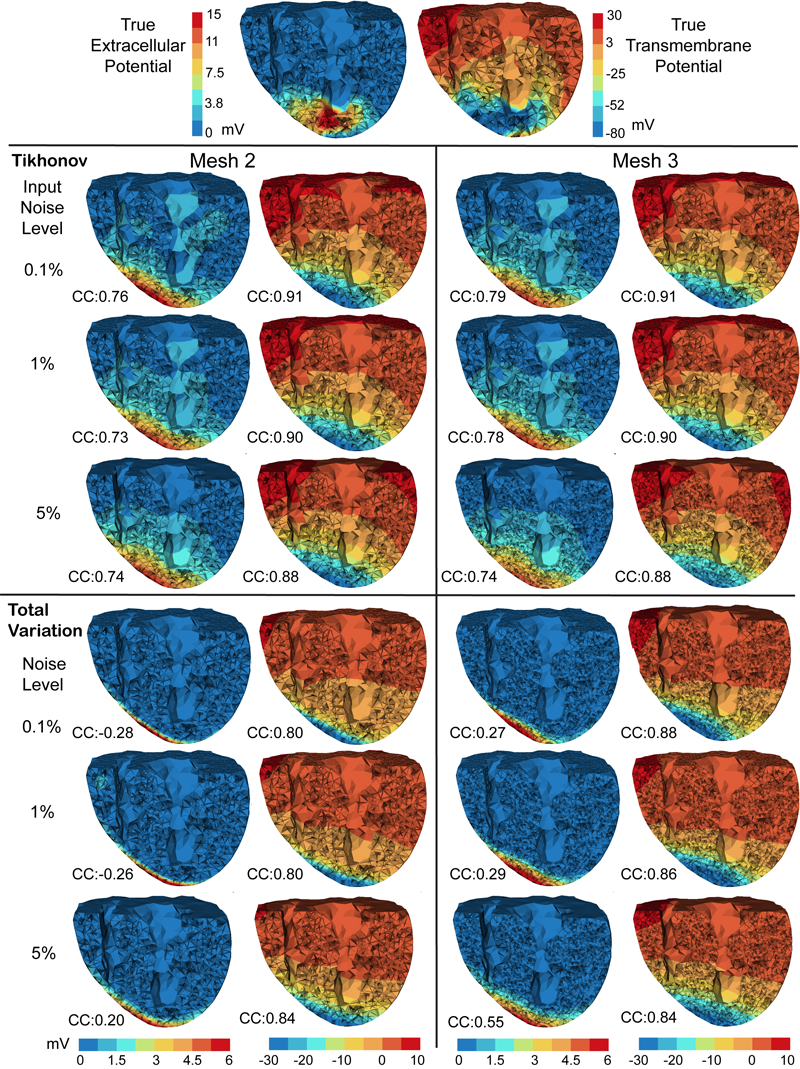
D. Wang, R.M. Kirby, R.S. MacLeod, C.R. Johnson.
“Inverse Electrocardiographic Source Localization of Ischemia: An Optimization Framework and Finite Element Solution,” In Journal of Computational Physics, Vol. 250, Academic Press, pp. 403--424. 2013.
ISSN: 0021-9991
DOI: 10.1016/j.jcp.2013.05.027
Keywords: cvrti, 2P41 GM103545-14
![]()
R.T. Whitaker, M. Mirzargar, R.M. Kirby.
“Contour Boxplots: A Method for Characterizing Uncertainty in Feature Sets from Simulation Ensembles,” In IEEE Transactions on Visualization and Computer Graphics, Vol. 19, No. 12, pp. 2713--2722. December, 2013.
DOI: 10.1109/TVCG.2013.143
PubMed ID: 24051838
2012
![]()
J. King, H. Mirzaee, J.K. Ryan, R.M. Kirby.
“Smoothness-Increasing Accuracy-Conserving (SIAC) Filtering for discontinuous Galerkin Solutions: Improved Errors Versus Higher-Order Accuracy,” In Journal of Scientific Computing, Vol. 53, pp. 129--149. 2012.
DOI: 10.1007/s10915-012-9593-8
Smoothness-increasing accuracy-conserving (SIAC) filtering has demonstrated its effectiveness in raising the convergence rate of discontinuous Galerkin solutions from order k + 1/2 to order 2k + 1 for specific types of translation invariant meshes (Cockburn et al. in Math. Comput. 72:577–606, 2003; Curtis et al. in SIAM J. Sci. Comput. 30(1):272– 289, 2007; Mirzaee et al. in SIAM J. Numer. Anal. 49:1899–1920, 2011). Additionally, it improves the weak continuity in the discontinuous Galerkin method to k - 1 continuity. Typically this improvement has a positive impact on the error quantity in the sense that it also reduces the absolute errors. However, not enough emphasis has been placed on the difference between superconvergent accuracy and improved errors. This distinction is particularly important when it comes to understanding the interplay introduced through meshing, between geometry and filtering. The underlying mesh over which the DG solution is built is important because the tool used in SIAC filtering—convolution—is scaled by the geometric mesh size. This heavily contributes to the effectiveness of the post-processor. In this paper, we present a study of this mesh scaling and how it factors into the theoretical errors. To accomplish the large volume of post-processing necessary for this study, commodity streaming multiprocessors were used; we demonstrate for structured meshes up to a 50× speed up in the computational time over traditional CPU implementations of the SIAC filter.
![]()
B. Nelson, E. Liu, R.M. Kirby, R. Haimes.
“ElVis: A System for the Accurate and Interactive Visualization of High-Order Finite Element Solutions,” In IEEE Transactions on Visualization and Computer Graphics (TVCG), Vol. 18, No. 12, pp. 2325--2334. Dec, 2012.
DOI: 10.1109/TVCG.2012.218
![]()
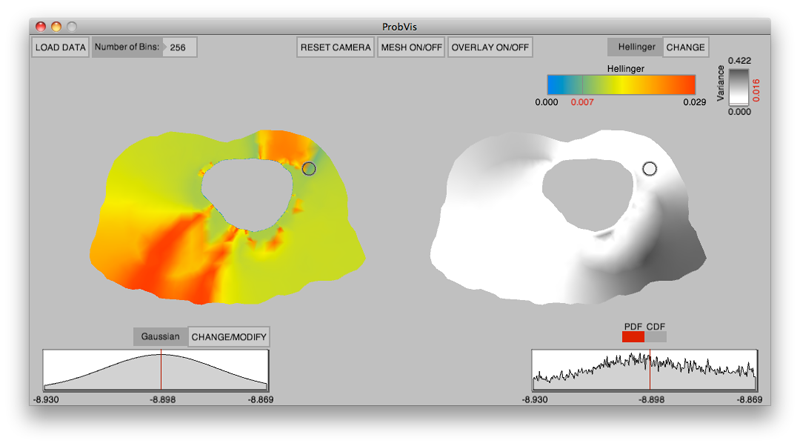
K. Potter, R.M. Kirby, D. Xiu, C.R. Johnson.
“Interactive visualization of probability and cumulative density functions,” In International Journal of Uncertainty Quantification, Vol. 2, No. 4, pp. 397--412. 2012.
DOI: 10.1615/Int.J.UncertaintyQuantification.2012004074
PubMed ID: 23543120
PubMed Central ID: PMC3609671
Keywords: visualization, probability density function, cumulative density function, generalized polynomial chaos, stochastic Galerkin methods, stochastic collocation methods
![]()
H. Tiesler, R.M. Kirby, D. Xiu, T. Preusser.
“Stochastic Collocation for Optimal Control Problems with Stochastic PDE Constraints,” In SIAM Journal on Control and Optimization, Vol. 50, No. 5, pp. 2659--2682. 2012.
DOI: 10.1137/110835438
We discuss the use of stochastic collocation for the solution of optimal control problems which are constrained by stochastic partial differential equations (SPDE). Thereby the constraining, SPDE depends on data which is not deterministic but random. Assuming a deterministic control, randomness within the states of the input data will propagate to the states of the system. For the solution of SPDEs there has recently been an increasing effort in the development of efficient numerical schemes based upon the mathematical concept of generalized polynomial chaos. Modal-based stochastic Galerkin and nodal-based stochastic collocation versions of this methodology exist, both of which rely on a certain level of smoothness of the solution in the random space to yield accelerated convergence rates. In this paper we apply the stochastic collocation method to develop a gradient descent as well as a sequential quadratic program (SQP) for the minimization of objective functions constrained by an SPDE. The stochastic function involves several higher-order moments of the random states of the system as well as classical regularization of the control. In particular we discuss several objective functions of tracking type. Numerical examples are presented to demonstrate the performance of our new stochastic collocation minimization approach.
Keywords: stochastic collocation, optimal control, stochastic partial differential equations
2011
![]()
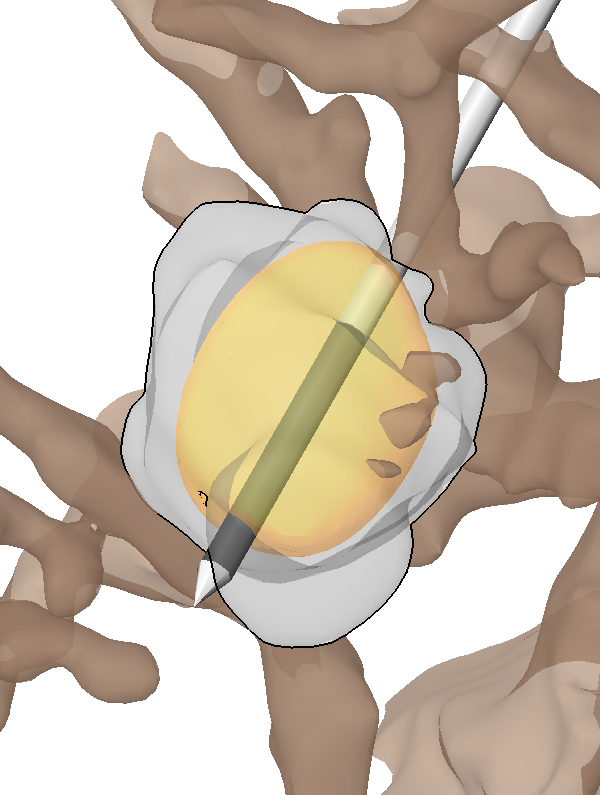
I. Altrogge, T. Preusser, T. Kroeger, S. Haase, T. Paetz, R.M. Kirby.
“Sensitivity Analysis for the Optimization of Radiofrequency Ablation in the Presence of Material Parameter Uncertainty,” In International Journal for Uncertainty Quantification, 2011.
Keywords: netl, stochastic sensitivity analysis, stochastic partial di erential equations, stochastic nite element method, adaptive sparse grid, heat transfer, multiscale modeling, representation of uncertainty
![]()
C.D. Cantwell, S.J. Sherwin, R.M. Kirby, P.H.J. Kelly.
“From h to p Efficiently: Strategy Selection for Operator Evaluation on Hexahedral and Tetrahedral Elements,” In Computers and Fluids, Vol. 43, No. 1, pp. 23--28. 2011.
DOI: 10.1016/j.compfluid.2010.08.012
Page 4 of 10