


Visualization
Visualization, sometimes referred to as visual data analysis, uses the graphical representation of data as a means of gaining understanding and insight into the data. Visualization research at SCI has focused on applications spanning computational fluid dynamics, medical imaging and analysis, biomedical data analysis, healthcare data analysis, weather data analysis, poetry, network and graph analysis, financial data analysis, etc.Research involves novel algorithm and technique development to building tools and systems that assist in the comprehension of massive amounts of (scientific) data. We also research the process of creating successful visualizations.
We strongly believe in the role of interactivity in visual data analysis. Therefore, much of our research is concerned with creating visualizations that are intuitive to interact with and also render at interactive rates.
Visualization at SCI includes the academic subfields of Scientific Visualization, Information Visualization and Visual Analytics.


Mike Kirby
Uncertainty Visualization

Alex Lex
Information Visualization
Centers and Labs:
- Visualization Design Lab (VDL)
- CEDMAV
- POWDER Display Wall
- Modeling, Display, and Understanding Uncertainty in Simulations for Policy Decision Making
- Topological Data Analysis for Large Network Visualization
Funded Research Projects:
Publications in Visualization:
  Pathfinder: Visual Analysis of Paths in Graphs C. Partl, S. Gratzl, M. Streit, A. Wassermann, H. Pfister, D. Schmalstieg, A. Lex. In Computer Graphics Forum (EuroVis '16), Vol. 35, No. 3, pp. 71-80. jun, 2016. ISSN: 1467-8659 DOI: 10.1111/cgf.12883 The analysis of paths in graphs is highly relevant in many domains. Typically, path-related tasks are performed in node-link layouts. Unfortunately, graph layouts often do not scale to the size of many real world networks. Also, many networks are multivariate, i.e., contain rich attribute sets associated with the nodes and edges. These attributes are often critical in judging paths, but directly visualizing attributes in a graph layout exacerbates the scalability problem. In this paper, we present visual analysis solutions dedicated to path-related tasks in large and highly multivariate graphs. We show that by focusing on paths, we can address the scalability problem of multivariate graph visualization, equipping analysts with a powerful tool to explore large graphs. We introduce Pathfinder, a technique that provides visual methods to query paths, while considering various constraints. The resulting set of paths is visualized in both a ranked list and as a node-link diagram. For the paths in the list, we display rich attribute data associated with nodes and edges, and the node-link diagram provides topological context. The paths can be ranked based on topological properties, such as path length or average node degree, and scores derived from attribute data. Pathfinder is designed to scale to graphs with tens of thousands of nodes and edges by employing strategies such as incremental query results. We demonstrate Pathfinder's fitness for use in scenarios with data from a coauthor network and biological pathways. |
| From Visual Exploration to Storytelling and Back Again Samuel Gratzl, Alexander Lex, Nils Gehlenborg, Nicola Cosgrove, Marc Streit . In Computer Graphics Forum, Vol. 35, No. 3, pp. 491--500. jun, 2016. ISSN: 1467-8659 DOI: 10.1111/cgf.12925 The primary goal of visual data exploration tools is to enable the discovery of new insights. To justify and reproduce insights, the discovery process needs to be documented and communicated. A common approach to documenting and presenting findings is to capture visualizations as images or videos. Images, however, are insufficient for telling the story of a visual discovery, as they lack full provenance information and context. Videos are difficult to produce and edit, particularly due to the non-linear nature of the exploratory process. Most importantly, however, neither approach provides the opportunity to return to any point in the exploration in order to review the state of the visualization in detail or to conduct additional analyses. In this paper we present CLUE (Capture, Label, Understand, Explain), a model that tightly integrates data exploration and presentation of discoveries. Based on provenance data captured during the exploration process, users can extract key steps, add annotations, and author "Vistories", visual stories based on the history of the exploration. These Vistories can be shared for others to view, but also to retrace and extend the original analysis. We discuss how the CLUE approach can be integrated into visualization tools and provide a prototype implementation. Finally, we demonstrate the general applicability of the model in two usage scenarios: a Gapminder-inspired visualization to explore public health data and an example from molecular biology that illustrates how Vistories could be used in scientific journals. |
| Embedded Domain-Specific Language and Runtime System for Progressive Spatiotemporal Data Analysis and Visualization C. Christensen, S. Liu, G. Scorzelli, J. Lee, P.-T. Bremer, V. Pascucci. In Symposium on Large Data Analysis and Visualization, IEEE, 2016. As our ability to generate large and complex datasets grows, accessing and processing these massive data collections is increasingly the primary bottleneck in scientific analysis. Challenges include retrieving, converting, resampling, and combining remote and often disparately located data ensembles with only limited support from existing tools. In particular, existing solutions rely predominantly on extensive data transfers or large-scale remote computing resources, both of which are inherently offline processes with long delays and substantial repercussions for any mistakes. Such workflows severely limit the flexible exploration and rapid evaluation of new hypotheses that are crucial to the scientific process and thereby impede scientific discovery. Here we present an embedded domain-specific language (EDSL) specifically designed for the interactive exploration of largescale, remote data. Our EDSL allows users to express a wide range of data analysis operations in a simple and abstract manner. The underlying runtime system transparently resolves issues such as remote data access and resampling while at the same time maintaining interactivity through progressive and interruptible computation. This system enables, for the first time, interactive remote exploration of massive datasets such as the 7km NASA GEOS-5 Nature Run simulation, which previously have been analyzed only offline or at reduced resolution. |
| Visualization for Understanding Uncertainty in Activation Volumes for Deep Brain Stimulation B. Hollister, G. Duffley, C. Butson,, C.R. Johnson. In Eurographics Conference on Visualization, Edited by K.L. Ma G. Santucci, and J. van Wijk, 2016. We have created the Neurostimulation Uncertainty Viewer (nuView or nView) tool for exploring data arising from deep brain stimulation (DBS). Simulated volume of tissue activated (VTA), using clinical electrode placements, are recorded along withpatient outcomes in the Unified Parkinson's disease rating scale (UPDRS). The data is volumetric and sparse, with multi-value patient results for each activated voxel in the simulation. nView provides a collection of visual methods to explore the activated tissue to enhance understanding of electrode usage for improved therapy with DBS. |
| TOD-Tree: Task-Overlapped Direct send Tree Image Compositing for Hybrid MPI Parallelism and GPUs A. V. P. Grosset, M. Prasad, C. Christensen, A. Knoll, C. Hansen. In IEEE Transactions on Visualization and Computer Graphics, IEEE, pp. 1--1. 2016. DOI: 10.1109/tvcg.2016.2542069 Modern supercomputers have thousands of nodes, each with CPUs and/or GPUs capable of several teraflops. However, the network connecting these nodes is relatively slow, on the order of gigabits per second. For time-critical workloads such as interactive visualization, the bottleneck is no longer computation but communication. In this paper, we present an image compositing algorithm that works on both CPU-only and GPU-accelerated supercomputers and focuses on communication avoidance and overlapping communication with computation at the expense of evenly balancing the workload. The algorithm has three stages: a parallel direct send stage, followed by a tree compositing stage and a gather stage. We compare our algorithm with radix-k and binary-swap from the IceT library in a hybrid OpenMP/MPI setting on the Stampede and Edison supercomputers, show strong scaling results and explain how we generally achieve better performance than these two algorithms. We developed a GPU-based image compositing algorithm where we use CUDA kernels for computation and GPU Direct RDMA for inter-node GPU communication. We tested the algorithm on the Piz Daint GPU-accelerated supercomputer and show that we achieve performance on par with CPUs. Lastly, we introduce a workflow in which both rendering and compositing are done on the GPU. |
| Dynamically Scheduled Region-Based Image Compositing A.V. P. Grosset, A. Knoll, C.D. Hansen. In Eurographics Symposium on Parallel Graphics and Visualization, June, 2016. Algorithms for sort-last parallel volume rendering on large distributed memory machines usually divide a dataset equally across all nodes for rendering. Depending on the features that a user wants to see in a dataset, all the nodes will rarely finish rendering at the same time. Existing compositing algorithms do not often take this into consideration, which can lead to significant delays when nodes that are compositing wait for other nodes that are still rendering. In this paper, we present an image compositing algorithm that uses spatial and temporal awareness to dynamically schedule the exchange of regions in an image and progressively composite images as they become available. Running on the Edison supercomputer at NERSC, we show that a scheduler-based algorithm with awareness of the spatial contribution from each rendering node can outperform traditional image compositing algorithms. |
| Kernel Partial Least Squares Regression for Relating Functional Brain Network Topology to Clinical Measures of Behavior E. Wong, S. Palande, Bei Wang, B. Zielinski, J. Anderson, P. T. Fletcher. In 2016 IEEE 13th International Symposium on Biomedical Imaging (ISBI), IEEE, April, 2016. DOI: 10.1109/isbi.2016.7493506 In this paper we present a novel method for analyzing the relationship between functional brain networks and behavioral phenotypes. Drawing from topological data analysis, we first extract topological features using persistent homology from functional brain networks that are derived from correlations in resting-state fMRI. Rather than fixing a discrete network topology by thresholding the connectivity matrix, these topological features capture the network organization across all continuous threshold values. We then propose to use a kernel partial least squares (kPLS) regression to statistically quantify the relationship between these topological features and behavior measures. The kPLS also provides an elegant way to combine multiple image features by using linear combinations of multiple kernels. In our experiments we test the ability of our proposed brain network analysis to predict autism severity from rs-fMRI. We show that combining correlations with topological features gives better prediction of autism severity than using correlations alone. |
| View-Dependent Streamline Deformation and Exploration X. Tong, J. Edwards, C. Chen, H. Shen, C. R. Johnson, P. Wong. In Transactions on Visualization and Computer Graphics, Vol. 22, No. 7, IEEE, pp. 1788--1801. July, 2016. ISSN: 1077-2626 DOI: 10.1109/tvcg.2015.2502583 Occlusion presents a major challenge in visualizing 3D flow and tensor fields using streamlines. Displaying too many streamlines creates a dense visualization filled with occluded structures, but displaying too few streams risks losing important features. We propose a new streamline exploration approach by visually manipulating the cluttered streamlines by pulling visible layers apart and revealing the hidden structures underneath. This paper presents a customized view-dependent deformation algorithm and an interactive visualization tool to minimize visual clutter in 3D vector and tensor fields. The algorithm is able to maintain the overall integrity of the fields and expose previously hidden structures. Our system supports both mouse and direct-touch interactions to manipulate the viewing perspectives and visualize the streamlines in depth. By using a lens metaphor of different shapes to select the transition zone of the targeted area interactively, the users can move their focus and examine the vector or tensor field freely. Keywords: Context;Deformable models;Lenses;Shape;Streaming media;Three-dimensional displays;Visualization;Flow visualization;deformation;focus+context;occlusion;streamline;white matter tracts |
|
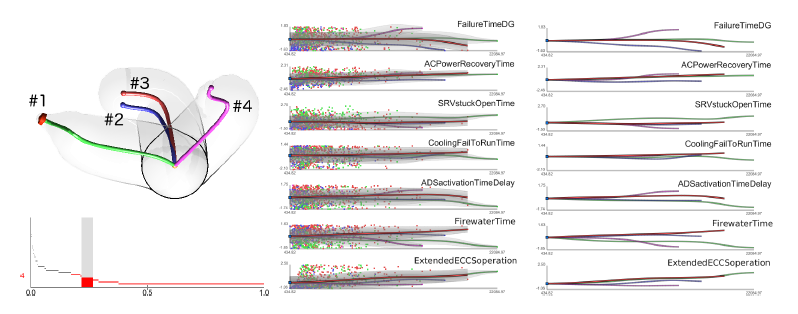
Analyzing Simulation-Based PRA Data Through Traditional and Topological Clustering: A BWR Station Blackout Case Study D. Maljovec, S. Liu, Bei Wang, V. Pascucci, P. T. Bremer, D. Mandelli, C. Smith.. In Reliability Engineering & System Safety, Vol. 145, Elsevier, pp. 262--276. January, 2016. DOI: 10.1016/j.ress.2015.07.001 Dynamic probabilistic risk assessment (DPRA) methodologies couple system simulator codes (e.g., RELAP, MELCOR) with simulation controller codes (e.g., RAVEN, ADAPT). Whereas system simulator codes model system dynamics deterministically, simulation controller codes introduce both deterministic (e.g., system control logic, operating procedures) and stochastic (e.g., component failures, parameter uncertainties) elements into the simulation. Typically, a DPRA is performed by sampling values of a set of parameters, and simulating the system behavior for that specific set of parameter values. For complex systems, a major challenge in using DPRA methodologies is to analyze the large number of scenarios generated, where clustering techniques are typically employed to better organize and interpret the data. In this paper, we focus on the analysis of two nuclear simulation datasets that are part of the risk-informed safety margin characterization (RISMC) boiling water reactor (BWR) station blackout (SBO) case study. We provide the domain experts a software tool that encodes traditional and topological clustering techniques within an interactive analysis and visualization environment, for understanding the structures of such high-dimensional nuclear simulation datasets. We demonstrate through our case study that both types of clustering techniques complement each other in bringing enhanced structural understanding of the data. |

|
muView: A Visual Analysis System for Exploring Uncertainty in Myocardial Ischemia Simulations P. Rosen, B. Burton, K. Potter, C.R. Johnson. In Visualization in Medicine and Life Sciences III, Springer Nature, pp. 49--69. 2016. DOI: 10.1007/978-3-319-24523-2_3 In this paper we describe the Myocardial Uncertainty Viewer (muView or µView) system for exploring data stemming from the simulation of cardiac ischemia. The simulation uses a collection of conductivity values to understand how ischemic regions effect the undamaged anisotropic heart tissue. The data resulting from the simulation is multi-valued and volumetric, and thus, for every data point, we have a collection of samples describing cardiac electrical properties. µView combines a suite of visual analysis methods to explore the area surrounding the ischemic zone and identify how perturbations of variables change the propagation of their effects. In addition to presenting a collection of visualization techniques, which individually highlight different aspects of the data, the coordinated view system forms a cohesive environment for exploring the simulations.We also discuss the findings of our study, which are helping to steer further development of the simulation and strengthening our collaboration with the biomedical engineers attempting to understand the phenomenon. |
| Vials: Visualizing Alternative Splicing of Genes H. Strobelt, B. Alsallakh, J. Botros, B. Peterson, M. Borowsky, H. Pfister,, A. Lex. In IEEE Transactions on Visualization and Computer Graphics (InfoVis '15), Vol. 22, No. 1, pp. 399-408. 2015. Alternative splicing is a process by which the same DNA sequence is used to assemble different proteins, called protein isoforms. Alternative splicing works by selectively omitting some of the coding regions (exons) typically associated with a gene. Detection of alternative splicing is difficult and uses a combination of advanced data acquisition methods and statistical inference. Knowledge about the abundance of isoforms is important for understanding both normal processes and diseases and to eventually improve treatment through targeted therapies. The data, however, is complex and current visualizations for isoforms are neither perceptually efficient nor scalable. To remedy this, we developed Vials, a novel visual analysis tool that enables analysts to explore the various datasets that scientists use to make judgments about isoforms: the abundance of reads associated with the coding regions of the gene, evidence for junctions, i.e., edges connecting the coding regions, and predictions of isoform frequencies. Vials is scalable as it allows for the simultaneous analysis of many samples in multiple groups. Our tool thus enables experts to (a) identify patterns of isoform abundance in groups of samples and (b) evaluate the quality of the data. We demonstrate the value of our tool in case studies using publicly available datasets. |
| OceanPaths: Visualizing Multivariate Oceanography Data C. Nobre, A. Lex. In Eurographics Conference on Visualization (EuroVis) - Short Papers, Edited by E. Bertini, J. Kennedy, E. Puppo, The Eurographics Association, 2015. DOI: 10.2312/eurovisshort.20151124 Geographical datasets are ubiquitous in oceanography. While map-based visualizations are useful for many different domains, they can suffer from cluttering and overplotting issues when used for multivariate data sets. As a result, spatial data exploration in oceanography has often been restricted to multiple maps showing various depths or time intervals. This lack of interactive exploration often hinders efforts to expose correlations between properties of oceanographic features, specifically currents. OceanPaths provides powerful interaction and exploration methods for spatial, multivariate oceanography datasets to remedy these situations. Fundamentally, our method allows users to define pathways, typically following currents, along which the variation of the high-dimensional data can be plotted efficiently. We present a case study conducted by domain experts to underscore the usefulness of OceanPaths in uncovering trends and correlations in oceanographic data sets. |
| Approximating the Generalized Voronoi Diagram of Closely Spaced Objects J. Edwards, E. Daniel, V. Pascucci, C. Bajaj. In Computer Graphics Forum, Vol. 34, No. 2, Wiley-Blackwell, pp. 299-309. May, 2015. DOI: 10.1111/cgf.12561 Generalized Voronoi Diagrams (GVDs) have far-reaching applications in robotics, visualization, graphics, and simulation. However, while the ordinary Voronoi Diagram has mature and efficient algorithms for its computation, the GVD is difficult to compute in general, and in fact, has only approximation algorithms for anything but the simplest of datasets. Our work is focused on developing algorithms to compute the GVD efficiently and with bounded error on the most difficult of datasets -- those with objects that are extremely close to each other. |
| Paint and Click: Unified Interactions for Image Boundaries B. Summa, A. A. Gooch, G. Scorzelli, V. Pascucci. In Computer Graphics Forum, Vol. 34, No. 2, Wiley-Blackwell, pp. 385--393. May, 2015. DOI: 10.1111/cgf.12568 Image boundaries are a fundamental component of many interactive digital photography techniques, enabling applications such as segmentation, panoramas, and seamless image composition. Interactions for image boundaries often rely on two complementary but separate approaches: editing via painting or clicking constraints. In this work, we provide a novel, unified approach for interactive editing of pairwise image boundaries that combines the ease of painting with the direct control of constraints. Rather than a sequential coupling, this new formulation allows full use of both interactions simultaneously, giving users unprecedented flexibility for fast boundary editing. To enable this new approach, we provide technical advancements. In particular, we detail a reformulation of image boundaries as a problem of finding cycles, expanding and correcting limitations of the previous work. Our new formulation provides boundary solutions for painted regions with performance on par with state-of-the-art specialized, paint-only techniques. In addition, we provide instantaneous exploration of the boundary solution space with user constraints. Finally, we provide examples of common graphics applications impacted by our new approach. |
| An Introduction to Verification of Visualization Techniques T. Etiene, R.M. Kirby, C. Silva. Morgan & Claypool Publishers, 2015. |
| Visualization C.R. Johnson. In Encyclopedia of Applied and Computational Mathematics, Edited by Björn Engquist, Springer, pp. 1537-1546. 2015. ISBN: 978-3-540-70528-4 DOI: 10.1007/978-3-540-70529-1_368 |
| Evaluating Alignment of Shapes by Ensemble Visualization M. Raj, M. Mirzargar, R. Kirby, R. Whitaker, J. Preston. In IEEE Computer Graphics and Applications, IEEE, 2015. The visualization of variability in 3D shapes or surfaces, which is a type of ensemble uncertainty visualization for volume data, provides a means of understanding the underlying distribution for a collection or ensemble of surfaces. While ensemble visualization for surfaces is already described in the literature, we conduct an expert-based evaluation in a particular medical imaging application: the construction of atlases or templates from a population of images. In this work, we extend contour boxplots to 3D, allowing us to evaluate it against an enumeration-style visualization of the ensemble members and also other conventional visualizations used by atlas builders, namely examining the atlas image and the corresponding images/data provided as part of the construction process. We present feedback from domain experts on the efficacy of contour boxplots compared to other modalities when used as part of the atlas construction and analysis stages of their work. |
|
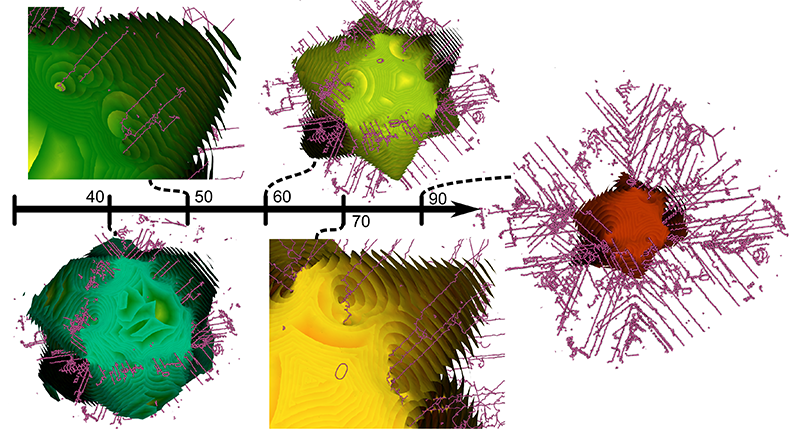
Interstitial and Interlayer Ion Diffusion Geometry Extraction in Graphitic Nanosphere Battery Materials A. Gyulassy, A. Knoll, K. C. Lau, Bei Wang, PT. Bremer, M.l E. Papka, L. A. Curtiss, V. Pascucci. In Proceedings IEEE Visualization Conference, 2015. Large-scale molecular dynamics (MD) simulations are commonly used for simulating the synthesis and ion diffusion of battery materials. A good battery anode material is determined by its capacity to store ion or other diffusers. However, modeling of ion diffusion dynamics and transport properties at large length and long time scales would be impossible with current MD codes. To analyze the fundamental properties of these materials, therefore, we turn to geometric and topological analysis of their structure. In this paper, we apply a novel technique inspired by discrete Morse theory to the Delaunay triangulation of the simulated geometry of a thermally annealed carbon nanosphere. We utilize our computed structures to drive further geometric analysis to extract the interstitial diffusion structure as a single mesh. Our results provide a new approach to analyze the geometry of the simulated carbon nanosphere, and new insights into the role of carbon defect size and distribution in determining the charge capacity and charge dynamics of these carbon based battery materials. |
| Workshop on Quantification, Communication, and Interpretation of Uncertainty in Simulation and Data Science R. Whitaker, W. Thompson, J. Berger, B. Fischhof, M. Goodchild, M. Hegarty, C. Jermaine, K. S. McKinley, A. Pang, J. Wendelberger. Note: Computing Community Consortium, 2015. Modern science, technology, and politics are all permeated by data that comes from people, measurements, or computational processes. While this data is often incomplete, corrupt, or lacking in sufficient accuracy and precision, explicit consideration of uncertainty is rarely part of the computational and decision making pipeline. The CCC Workshop on Quantification, Communication, and Interpretation of Uncertainty in Simulation and Data Science explored this problem, identifying significant shortcomings in the ways we currently process, present, and interpret uncertain data. Specific recommendations on a research agenda for the future were made in four areas: uncertainty quantification in large-scale computational simulations, uncertainty quantification in data science, software support for uncertainty computation, and better integration of uncertainty quantification and communication to stakeholders. |
|
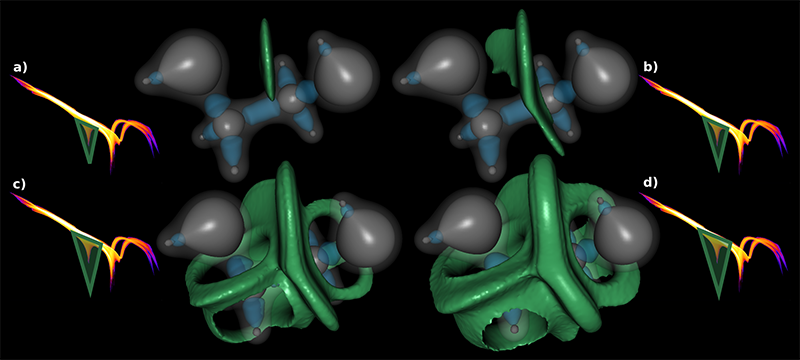
Fiber Surfaces: Generalizing Isosurfaces to Bivariate Data H. Carr, Z. Geng, J. Tierny, A. Chattophadhyay,, A. Knoll. In Computer Graphics Forum, Vol. 34, No. 3, pp. 241-250. 2015. Scientific visualization has many effective methods for examining and exploring scalar and vector fields, but rather fewer for multi-variate fields. We report the first general purpose approach for the interactive extraction of geometric separating surfaces in bivariate fields. This method is based on fiber surfaces: surfaces constructed from sets of fibers, the multivariate analogues of isolines. We show simple methods for fiber surface definition and extraction. In particular, we show a simple and efficient fiber surface extraction algorithm based on Marching Cubes. We also show how to construct fiber surfaces interactively with geometric primitives in the range of the function. We then extend this to build user interfaces that generate parameterized families of fiber surfaces with respect to arbitrary polylines and polygons. In the special case of isovalue-gradient plots, fiber surfaces capture features geometrically for quantitative analysis that have previously only been analysed visually and qualitatively using multi-dimensional transfer functions in volume rendering. We also demonstrate fiber surface extraction on a variety of bivariate data |