
SCI Publications
2014
![]()
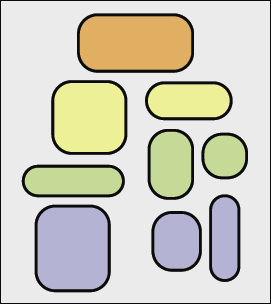
A. Bigelow, S. Drucker, D. Fisher, M.D. Meyer.
“Reflections on How Designers Design With Data,” In Proceedings of the ACM International Conference on Advanced Visual Interfaces (AVI), Note: Awarded Best Paper!, 2014.
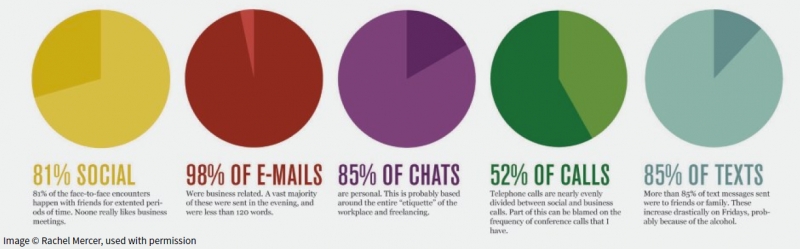
Keywords: Visualization, infographics, design practice
![]()
G. McInerny, M. Chen, R. Freeman, D. Gavaghan, M.D. Meyer, F. Rowland, D. Spiegelhalter, M. Steganer, G. Tessarolo, J. Hortal.
“Information Visualization for Science and Policy: Engaging Users and Avoiding Bias,” In Trends in Ecology & Evolution, Vol. 29, No. 3, pp. 148--157. 2014.
DOI: 10.1016/j.tree.2014.01.003

![]()
S. McKenna, D. Mazur, J. Agutter, M.D. Meyer.
“Design Activity Framework for Visualization Design,” In IEEE Transactions on Visualization and Computer Graphics (TVCG), 2014.
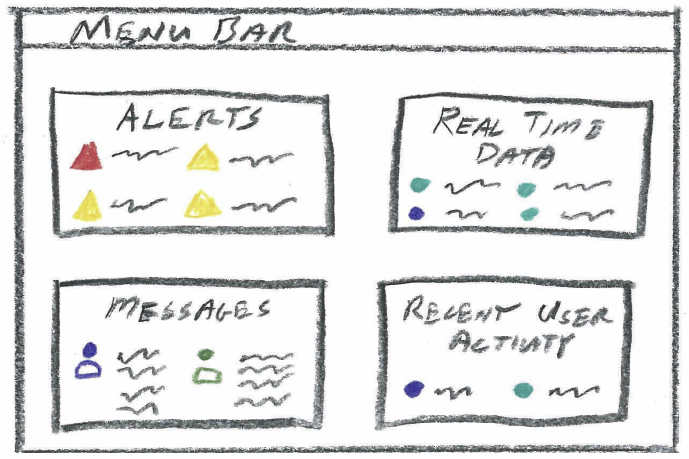
Keywords: Design, frameworks, process, cybersecurity, nested model, decisions, models, evaluation, visualization
![]()
M.D. Meyer, M. Sedlmair, P.S. Quinan, T. Munzner.
“The Nested Blocks and Guidelines Model,” In Journal of Information Visualization, Special Issue on Evaluation (BELIV), 2014.
2013
![]()
A. Abdul-Rahman, J. Lein, K. Coles, E. Maguire, M.D. Meyer, M. Wynne, C.R. Johnson, A. Trefethen, M. Chen.
“Rule-based Visual Mappings - with a Case Study on Poetry Visualization,” In Proceedings of the 2013 Eurographics Conference on Visualization (EuroVis), Vol. 32, No. 3, pp. 381--390. June, 2013.
![]()
M. Hall, R.M. Kirby, F. Li, M.D. Meyer, V. Pascucci, J.M. Phillips, R. Ricci, J. Van der Merwe, S. Venkatasubramanian.
“Rethinking Abstractions for Big Data: Why, Where, How, and What,” In Cornell University Library, 2013.
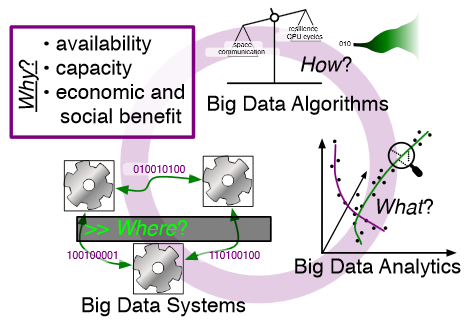
Big data refers to large and complex data sets that, under existing approaches, exceed the capacity and capability of current compute platforms, systems software, analytical tools and human understanding [7]. Numerous lessons on the scalability of big data can already be found in asymptotic analysis of algorithms and from the high-performance computing (HPC) and applications communities. However, scale is only one aspect of current big data trends; fundamentally, current and emerging problems in big data are a result of unprecedented complexity |in the structure of the data and how to analyze it, in dealing with unreliability and redundancy, in addressing the human factors of comprehending complex data sets, in formulating meaningful analyses, and in managing the dense, power-hungry data centers that house big data.
The computer science solution to complexity is finding the right abstractions, those that hide as much triviality as possible while revealing the essence of the problem that is being addressed. The "big data challenge" has disrupted computer science by stressing to the very limits the familiar abstractions which define the relevant subfields in data analysis, data management and the underlying parallel systems. Efficient processing of big data has shifted systems towards increasingly heterogeneous and specialized units, with resilience and energy becoming important considerations. The design and analysis of algorithms must now incorporate emerging costs in communicating data driven by IO costs, distributed data, and the growing energy cost of these operations. Data analysis representations as structural patterns and visualizations surpass human visual bandwidth, structures studied at small scale are rare at large scale, and large-scale high-dimensional phenomena cannot be reproduced at small scale.
As a result, not enough of these challenges are revealed by isolating abstractions in a traditional soft-ware stack or standard algorithmic and analytical techniques, and attempts to address complexity either oversimplify or require low-level management of details. The authors believe that the abstractions for big data need to be rethought, and this reorganization needs to evolve and be sustained through continued cross-disciplinary collaboration.
In what follows, we first consider the question of why big data and why now. We then describe the where (big data systems), the how (big data algorithms), and the what (big data analytics) challenges that we believe are central and must be addressed as the research community develops these new abstractions. We equate the biggest challenges that span these areas of big data with big mythological creatures, namely cyclops, that should be conquered.
![]()
R.M. Kirby, M.D. Meyer.
“Visualization Collaborations: What Works and Why,” In IEEE Computer Graphics and Applications: Visualization Viewpoints, Vol. 33, No. 6, pp. 82--88. 2013.
Of particular interest to us is their vision for collaboration. McCormick and his colleagues envisioned an interdisciplinary team that through close interaction would develop visualization tools that not only were effective in the context of their immediate collaborative environment but also could be reused by scientists and engineers in other fields. McCormick and his colleagues categorized the types of researchers they imagined constituting these teams, one type being the "visualization scientist/engineer." They even commented on the skills these individuals might have. However, they provided little guidance on how to make such teams successful.
In the more than 25 years since the report, researchers have refined the concepts of interaction versus collaboration,3 interdisciplinary versus multidisciplinary teams,4,5 and independence versus interdependence.6 Here, we use observations from our collective 18 years of collaborative visualization research to help shed light on not just the composition of current and future visualization collaborative teams but also pitfalls and recommendations for successful collaboration. Although our statements might reflect what seasoned visualization researchers are already doing, we believe that reexpressing and possibly reaffirming basic collaboration principles provide benefits.
2012
![]()
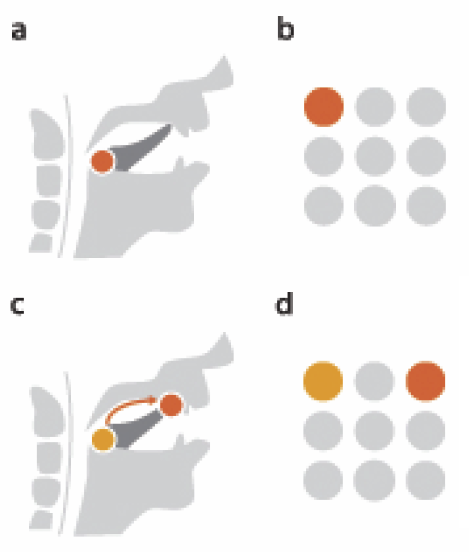
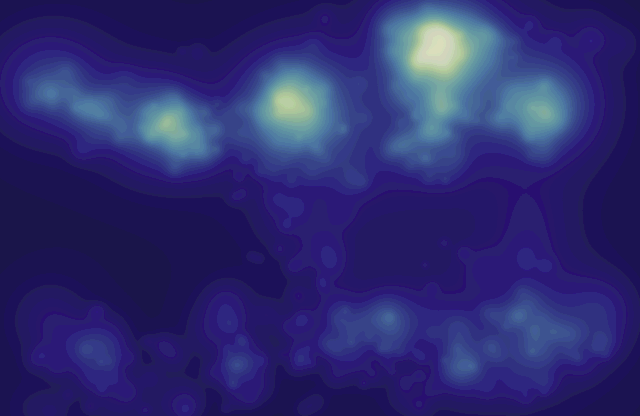
A. Duchowski, M. Price, M.D. Meyer, P. Orero.
“Aggregate Gaze Visualization with Real-Time Heatmaps,” In Proceedings of the ACM Symposium on Eye Tracking Research and Applications (ETRA), pp. 13--20. 2012.
DOI: 10.1145/2168556.2168558
![]()
M.D. Meyer, M. Sedlmair, T. Munzner.
“The Four-Level Nested Model Revisited: Blocks and Guidelines,” In Workshop on BEyond time and errors: novel evaLuation methods for Information Visualization (BELIV), IEEE VisWeek 2012, 2012.
![]()
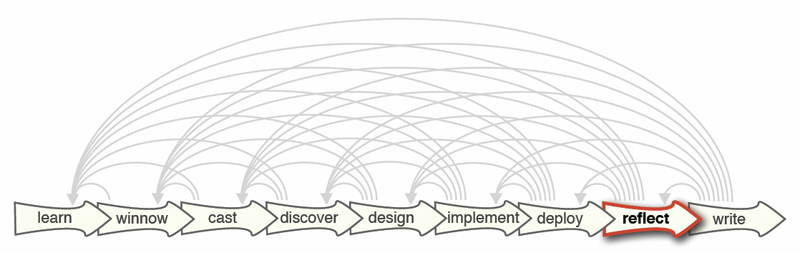
M. Sedlmair, M.D. Meyer, T. Munzner.
“Design Study Methodology: Reflections from the Trenches and the Stacks,” In IEEE Transactions on Visualization and Computer Graphics, Vol. 18, No. 12, Note: Honorable Mention for Best Paper Award., pp. 2431--2440. 2012.
Design studies are an increasingly popular form of problem-driven visualization research, yet there is little guidance available about how to do them effectively. In this paper we reflect on our combined experience of conducting twenty-one design studies, as well as reading and reviewing many more, and on an extensive literature review of other field work methods and methodologies. Based on this foundation we provide definitions, propose a methodological framework, and provide practical guidance for conducting design studies. We define a design study as a project in which visualization researchers analyze a specific real-world problem faced by domain experts, design a visualization system that supports solving this problem, validate the design, and reflect about lessons learned in order to refine visualization design guidelines. We characterize two axes—a task clarity axis from fuzzy to crisp and an information location axis from the domain expert’s head to the computer—and use these axes to reason about design study contributions, their suitability, and uniqueness from other approaches. The proposed methodological framework consists of 9 stages: learn, winnow, cast, discover, design, implement, deploy, reflect, and write. For each stage we provide practical guidance and outline potential pitfalls. We also conducted an extensive literature survey of related methodological approaches that involve a significant amount of qualitative field work, and compare design study methodology to that of ethnography, grounded theory, and action research.
2011
![]()
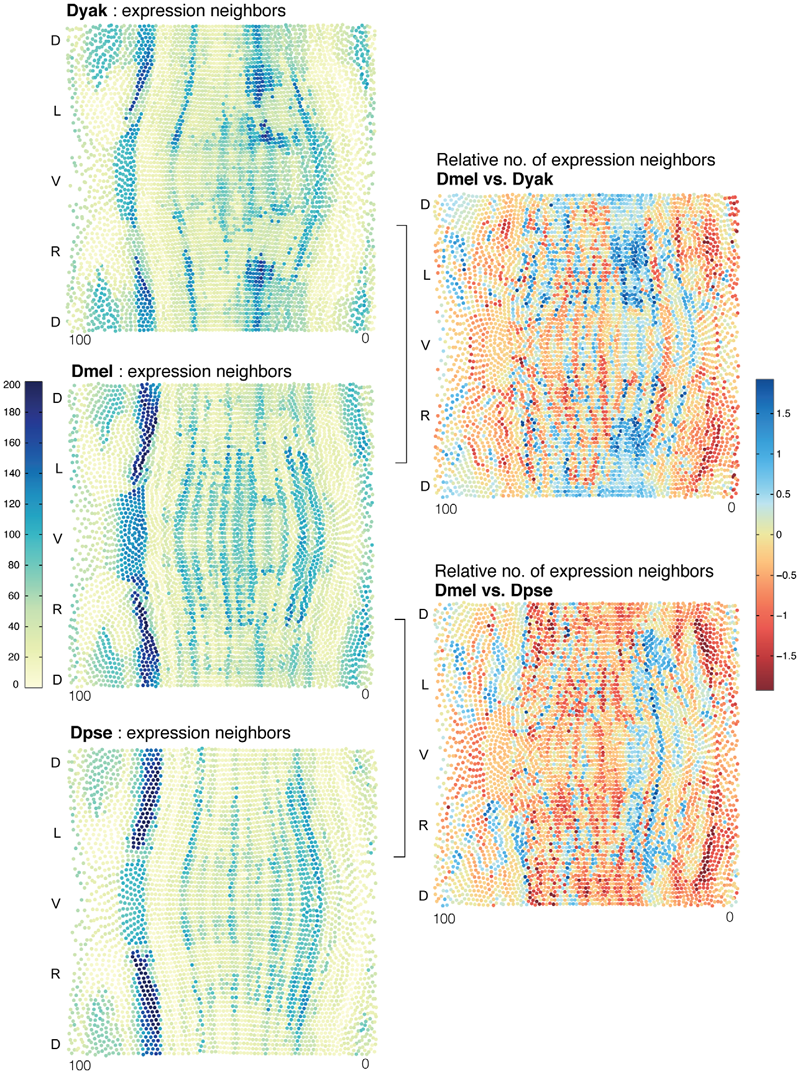
C. Fowlkes, K. Eckenrode, M. Bragdon, M.D. Meyer, Z. Wunderlich, L. Simirenko, C. Luengo, S. Keranen, C. Henriquez, D. Knowles, M. Biggin, M. Eisen, A. DePace.
“A Conservered Developmental Patterning Network Produces Quantitatively Different Output in Multiple Species of Drosophila,” In PLoS Genetics, Vol. 7, No. 10:e1002346, pp. 17 pages. October, 2011.
2010
![]()
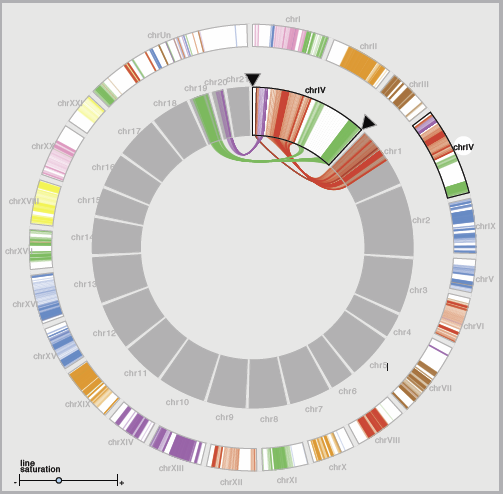
M. Grabherr, P. Russell, M.D. Meyer, E. Mauceli, J. Alföldi, F. Di Palma, K. Lindblad-Toh.
“Genome-wide synteny through highly sensitive sequence alignment: Satsuma,” In Bioinformatics, Vol. 26, No. 9, pp. 1145--1151. 2010.
Motivation: Comparative genomics heavily relies on alignments of large and often complex DNA sequences. From an engineering perspective, the problem here is to provide maximum sensitivity (to find all there is to find), specificity (to only find real homology) and speed (to accommodate the billions of base pairs of vertebrate genomes).
Results: Satsuma addresses all three issues through novel strategies: (i) cross-correlation, implemented via fast Fourier transform; (ii) a match scoring scheme that eliminates almost all false hits; and (iii) an asynchronous 'battleship'-like search that allows for aligning two entire fish genomes (470 and 217 Mb) in 120 CPU hours using 15 processors on a single machine.
Availability: Satsuma is part of the Spines software package, implemented in C++ on Linux. The latest version of Spines can be freely downloaded under the LGPL license from http://www.broadinstitute.org/science/programs/genome-biology/spines/ Contact: grabherr@broadinstitute.org
![]()
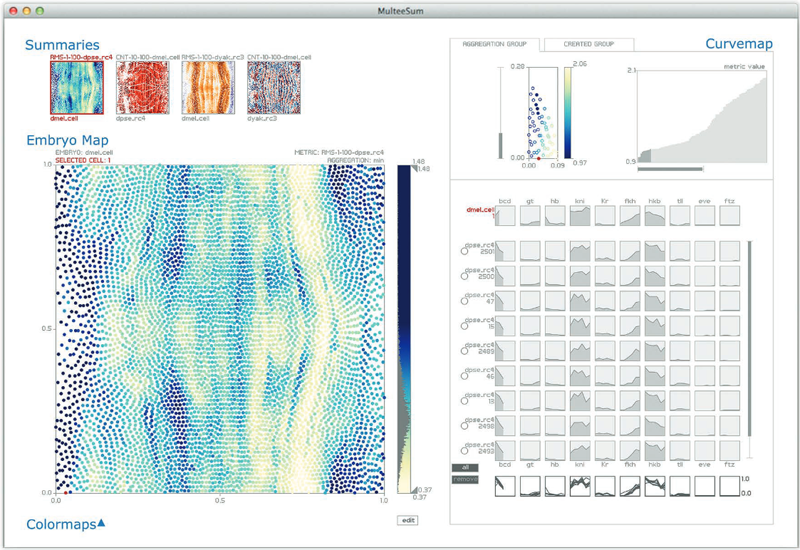
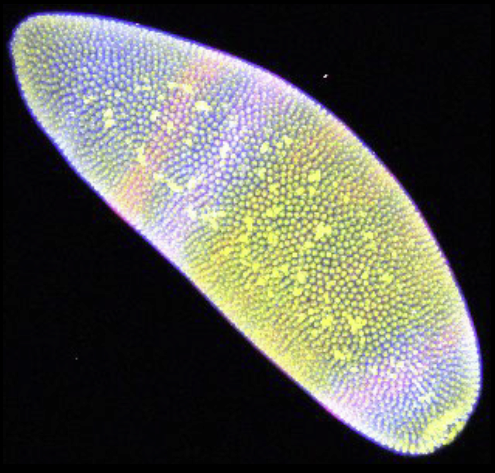
M.D. Meyer, T. Munzner, A. DePace, H. Pfister.
“MulteeSum: A Tool for Comparative Spatial and Temporal Gene Expression Data,” In IEEE Transactions on Visualization and Computer Graphics (Proceedings of InfoVis 2010), Vol. 16, No. 6, pp. 908--917. 2010.
![]()
M.D. Meyer, B. Wong, M. Styczynski, T. Munzner, H. Pfister.
“Pathline: A Tool for Comparative Functional Genomics,” In Computer Graphics Forum, Vol. 29, No. 3, Wiley-Blackwell, pp. 1043--1052. Aug, 2010.
DOI: 10.1111/j.1467-8659.2009.01710.x
Biologists pioneering the new field of comparative functional genomics attempt to infer the mechanisms of gene regulation by looking for similarities and differences of gene activity over time across multiple species. They use three kinds of data: functional data such as gene activity measurements, pathway data that represent a series of reactions within a cellular process, and phylogenetic relationship data that describe the relatedness of species. No existing visualization tool can visually encode the biologically interesting relationships between multiple pathways, multiple genes, and multiple species. We tackle the challenge of visualizing all aspects of this comparative functional genomics dataset with a new interactive tool called Pathline. In addition to the overall characterization of the problem and design of Pathline, our contributions include two new visual encoding techniques. One is a new method for linearizing metabolic pathways that provides appropriate topological information and supports the comparison of quantitative data along the pathway. The second is the curvemap view, a depiction of time series data for comparison of gene activity and metabolite levels across multiple species. Pathline was developed in close collaboration with a team of genomic scientists. We validate our approach with case studies of the biologists' use of Pathline and report on how they use the tool to confirm existing findings and to discover new scientific insights.
2009
![]()
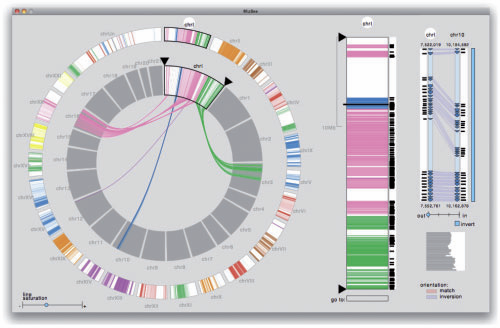
M.D. Meyer, T. Munzner, H. Pfister.
“MizBee: A Multiscale Synteny Browser,” In IEEE Transactions on Visualization and Computer Graphics (Proceedings of InfoVis 2009), Vol. 15, No. 6, Note: Honorable Mention for Best Paper Award, pp. 897--904. 2009.
![]()
A.R. Sanderson, M.D. Meyer, R.M. Kirby, C.R. Johnson.
“A Framework for Exploring Numerical Solutions of Advection Reaction Diffusion Equations using a GPU Based Approach,” In Journal of Computing and Visualization in Science, Vol. 12, pp. 155--170. 2009.
DOI: 10.1007/s00791-008-0086-0
2008
![]()
C. Ledergerber, G. Guennebaud, M.D. Meyer, M. Bacher, H. Pfister.
“Volume MLS Ray Casting,” In IEEE Transactions on Visualization and Computer Graphics (Proceedings of Visualization 2008), Vol. 14, No. 6, pp. 1539--1546. 2008.
![]()
M.D. Meyer, R.T. Whitaker, R.M. Kirby, C. Ledergerber, H. Pfister.
“Particle-based Sampling and Meshing of Surfaces in Multimaterial Volumes,” In IEEE Transactions on Visualization and Computer Graphics, Vol. 14, No. 6, pp. 1539--1546. 2008.
![]()
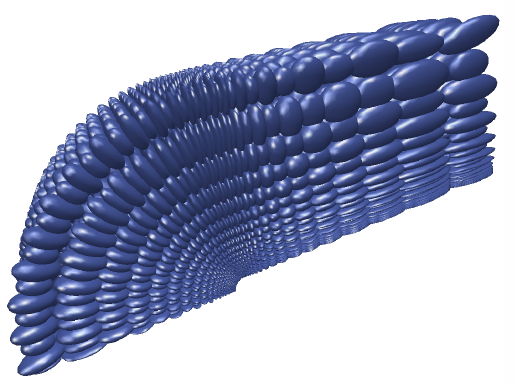
M.D. Meyer.
“Dynamic Particle Systems for Adaptive Sampling of Implicit Surfaces,” School of Computing, University of Utah, 2008.
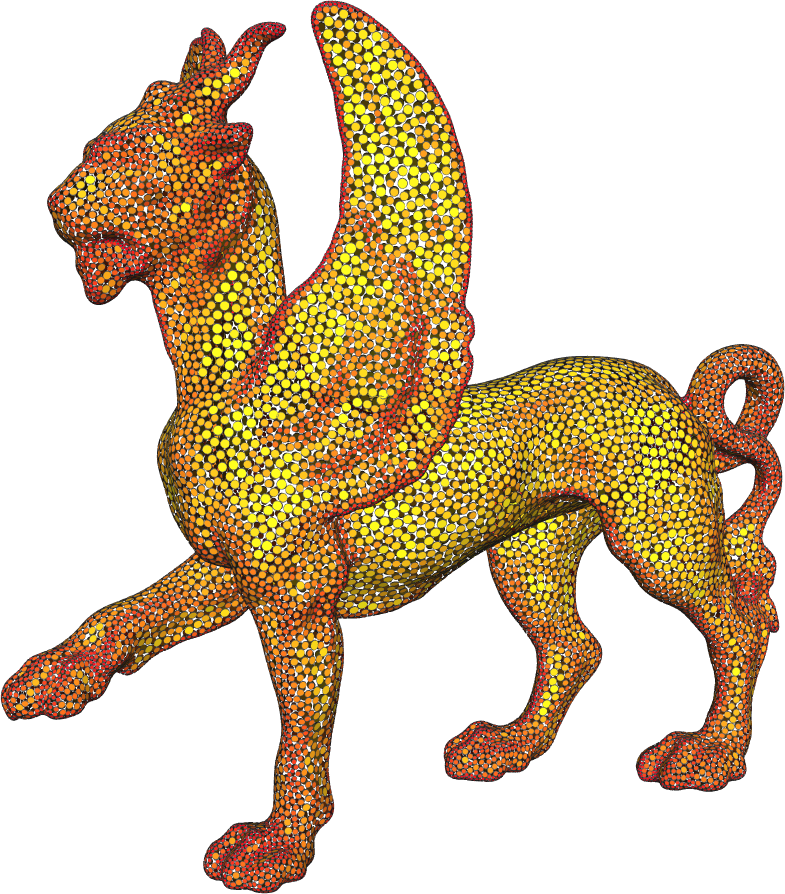
A ubiquitous requirement in many mathematical and computational problems is a set of well-placed point samples. For producing very even distributions of samples across complex surfaces, a dynamic particle system is a controllable mechanism that naturally accommodates strict sampling requirements. The systemfirst constrains particles to a surface, and then moves the particles across the surface until they are arranged in minimal energy configurations. Adaptivity is added into the system by scaling the distance between particles, causing higher densities of points around surface features. In this dissertation we explore and refine the dynamics of particle systems for generating efficient and adaptive point samples of implicit surfaces.
Throughout this dissertation, we apply the adaptive particle system framework to several application areas. First, efficient visualizations of high-order finite element datasets are generated by developing adaptivity metrics of surfaces that exist in the presence of curvilinear coordinate transformation. Second, a framework is proposed that meets fundamental sampling constraints of Delaunay-based surface reconstruction algorithms. In meeting these constraints, the particle distributions produce nearly-regular, efficient isosurface tessellation that are geometrically and topologically accurate. And third, a novel analytic representation of material boundaries in multimaterial volume datasets is developed, as well as a set of projection operators, that allow for explicit sampling of nonmanifold material intersections. Using a tetrahedral labeling algorithm, the material intersections are extracted as watertight, nonmanifold meshes that are well-suited for simulations.
![]()
R.T. Whitaker, R.M. Kirby, J.G. Sinstra, M.D. Meyer.
“Multimaterial Meshing of MRI Head Data for Bioelectric Field Simulations,” In Proceedings of the 17th International Meshing Roundtable, 2008.
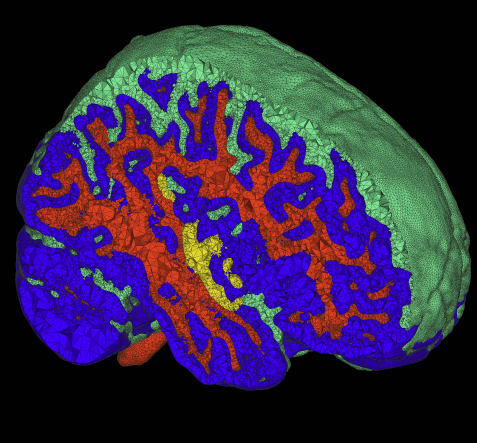
The problem of body fitting meshes that are both adaptive and geometrically accurate is important in a variety of biomedical applications in a multitude of clinical settings, including electrocardiology, neurology, and orthopedics. Adaptivity is necessary because of the combination of large-scale and smallscale structures (e.g. relatively small blood vessels spanning a human head). Geometric accuracy is important for several reasons. In some cases, such as computational fluid dynamics, the fine-scale structure of the fluid domain is important for qualitative and quantitative accuracy of the solutions. More generally, finite element approximations of elliptic problems with rough coefficients require increased spatial resolution normal to material boundaries [3]. The problem of constructing meshes from biomedical images is particularly difficult because of the complexity and irregularity of the structures, and thus tuning or correcting meshes by hand is quite difficult and time consuming. Many researchers and, indeed, commercial products simply subdivide the underlying hexahedral image grid and assign material properties to tetrahedra based on standard decomposition of each hexahedron into tetrahedra.
This paper presents a small case study of the results of a recently developed method for multimaterial, tetrahedral meshing of biomedical volumes [6]. The method uses an iterative relaxation of surface point point positions that are constrained to subsets of the volume that correspond to boundaries between different materials. In this paper we briefly review the method and present results on a set of MRI head images for use in bioelectric field simulation and source localization.
Page 1 of 2