
SCI Publications
2015
![]()
C.R. Johnson.
“Visualization,” In Encyclopedia of Applied and Computational Mathematics, Edited by Björn Engquist, Springer, pp. 1537-1546. 2015.
ISBN: 978-3-540-70528-4
DOI: 10.1007/978-3-540-70529-1_368
2014
![]()
G.P. Bonneau, H.C. Hege, C.R. Johnson, M.M. Oliveira, K. Potter, P. Rheingans, T. Schultz.
“Overview and State-of-the-Art of Uncertainty Visualization,” In Scientific Visualization: Uncertainty, Multifield, Biomedical, and Scalable Visualization, Edited by M. Chen and H. Hagen and C.D. Hansen and C.R. Johnson and A. Kauffman, Springer-Verlag, pp. 3--27. 2014.
ISBN: 978-1-4471-6496-8
ISSN: 1612-3786
DOI: 10.1007/978-1-4471-6497-5_1
![]()
B. Chapman, H. Calandra, S. Crivelli, J. Dongarra, J. Hittinger, C.R. Johnson, S.A. Lathrop, V. Sarkar, E. Stahlberg, J.S. Vetter, D. Williams.
“ASCAC Workforce Subcommittee Letter,” Note: Office of Scientific and Technical Information, DOE ASCAC Committee Report, July, 2014.
DOI: 10.2172/1222711
Simulation and computing are essential to much of the research conducted at the DOE national laboratories. Experts in the ASCR-relevant Computing Sciences, which encompass a range of disciplines including Computer Science, Applied Mathematics, Statistics and domain sciences, are an essential element of the workforce in nearly all of the DOE national laboratories. This report seeks to identify the gaps and challenges facing DOE with respect to this workforce.
The DOE laboratories provided the committee with information on disciplines in which they experienced workforce gaps. For the larger laboratories, the majority of the cited workforce gaps were in the Computing Sciences. Since this category spans multiple disciplines, it was difficult to obtain comprehensive information on workforce gaps in the available timeframe. Nevertheless, five multi-purpose laboratories provided additional relevant data on recent hiring and retention.
Data on academic coursework was reviewed. Studies on multidisciplinary education in Computational Science and Engineering (CS&E) revealed that, while the number of CS&E courses offered is growing, the overall availability is low and the coursework fails to provide skills for applying CS&E to real-world applications. The number of graduates in different fields within Computer Science (CS) and Computer Engineering (CE) was also reviewed, which confirmed that specialization in DOE areas of interest is less common than in many other areas.
Projections of industry needs and employment figures (mostly for CS and CE) were examined. They indicate a high and increasing demand for graduates in all areas of computing, with little unemployment. This situation will be exacerbated by large numbers of retirees in the coming decade. Further, relatively few US students study toward higher degrees in the Computing Sciences, and those who do are predominantly white and male. As a result of this demographic imbalance, foreign nationals are an increasing fraction of the graduate population and we fail to benefit from including women and underrepresented minorities.
There is already a program that supports graduate education that is tailored to the needs of the DOE laboratories. The Computational Science Graduate Fellowship (CSGF) enables graduates to pursue a multidisciplinary program of education that is coupled with practical experience at the laboratories. It has been demonstrated to be highly effective in both its educational goals and in its ability to supply talent to the laboratories. However, its current size and scope are too limited to solve the workforce problems identified. The committee felt strongly that this proven program should be extended to increase its ability to support the DOE mission.
Since no single program can eliminate the workforce gap, existing recruitment efforts by the laboratories were examined. It was found that the laboratories already make considerable effort to recruit in this area. Although some challenges, such as the inability to match industry compensation, cannot be directly addressed, DOE could develop a roadmap to increase the impact of individual laboratory efforts, to enhance the suitability of existing educational opportunities, to increase the attractiveness of the laboratories, and to attract and sustain a full spectrum of human talent, which includes women and underrepresented minorities.
![]()
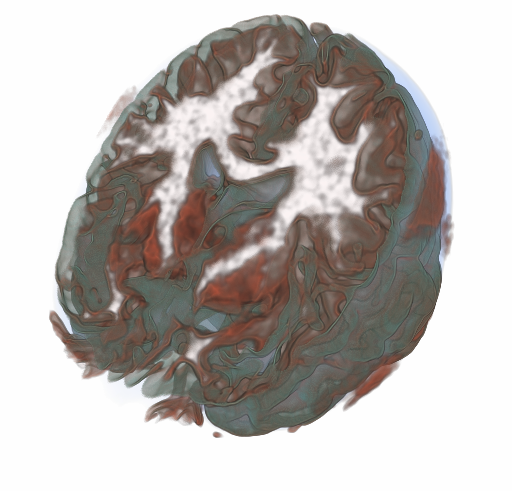
M.G. Genton, C.R. Johnson, K. Potter, G. Stenchikov, Y. Sun.
“Surface boxplots,” In Stat Journal, Vol. 3, No. 1, pp. 1--11. 2014.
In this paper, we introduce a surface boxplot as a tool for visualization and exploratory analysis of samples of images. First, we use the notion of volume depth to order the images viewed as surfaces. In particular, we define the median image. We use an exact and fast algorithm for the ranking of the images. This allows us to detect potential outlying images that often contain interesting features not present in most of the images. Second, we build a graphical tool to visualize the surface boxplot and its various characteristics. A graph and histogram of the volume depth values allow us to identify images of interest. The code is available in the supporting information of this paper. We apply our surface boxplot to a sample of brain images and to a sample of climate model outputs.
![]()
Y. Gur, C.R. Johnson.
“Generalized HARDI Invariants by Method of Tensor Contraction,” In Proceedings of the 2014 IEEE International Symposium on Biomedical Imaging (ISBI), pp. 718--721. April, 2014.
We propose a 3D object recognition technique to construct rotation invariant feature vectors for high angular resolution diffusion imaging (HARDI). This method uses the spherical harmonics (SH) expansion and is based on generating rank-1 contravariant tensors using the SH coefficients, and contracting them with covariant tensors to obtain invariants. The proposed technique enables the systematic construction of invariants for SH expansions of any order using simple mathematical operations. In addition, it allows construction of a large set of invariants, even for low order expansions, thus providing rich feature vectors for image analysis tasks such as classification and segmentation. In this paper, we use this technique to construct feature vectors for eighth-order fiber orientation distributions (FODs) reconstructed using constrained spherical deconvolution (CSD). Using simulated and in vivo brain data, we show that these invariants are robust to noise, enable voxel-wise classification, and capture meaningful information on the underlying white matter structure.
Keywords: Diffusion MRI, HARDI, invariants
C.D. Hansen, M. Chen, C.R. Johnson, A.E. Kaufman, H. Hagen (Eds.).
“Scientific Visualization: Uncertainty, Multifield, Biomedical, and Scalable Visualization,” Mathematics and Visualization, Springer, 2014.
ISBN: 978-1-4471-6496-8
2013
![]()
A. Abdul-Rahman, J. Lein, K. Coles, E. Maguire, M.D. Meyer, M. Wynne, C.R. Johnson, A. Trefethen, M. Chen.
“Rule-based Visual Mappings - with a Case Study on Poetry Visualization,” In Proceedings of the 2013 Eurographics Conference on Visualization (EuroVis), Vol. 32, No. 3, pp. 381--390. June, 2013.
![]()
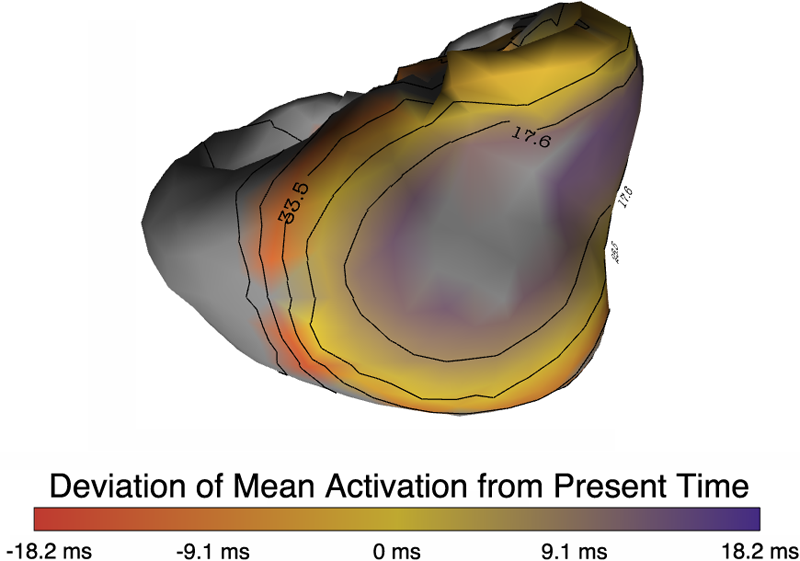
B. Burton, B. Erem, K. Potter, P. Rosen, C.R. Johnson, D. Brooks, R.S. Macleod.
“Uncertainty Visualization in Forward and Inverse Cardiac Models,” In Computing in Cardiology CinC, pp. 57--60. 2013.
ISSN: 2325-8861
![]()
J. Chen, A. Choudhary, S. Feldman, B. Hendrickson, C.R. Johnson, R. Mount, V. Sarkar, V. White, D. Williams.
“Synergistic Challenges in Data-Intensive Science and Exascale Computing,” Note: Summary Report of the Advanced Scientific Computing Advisory Committee (ASCAC) Subcommittee, March, 2013.
![]()
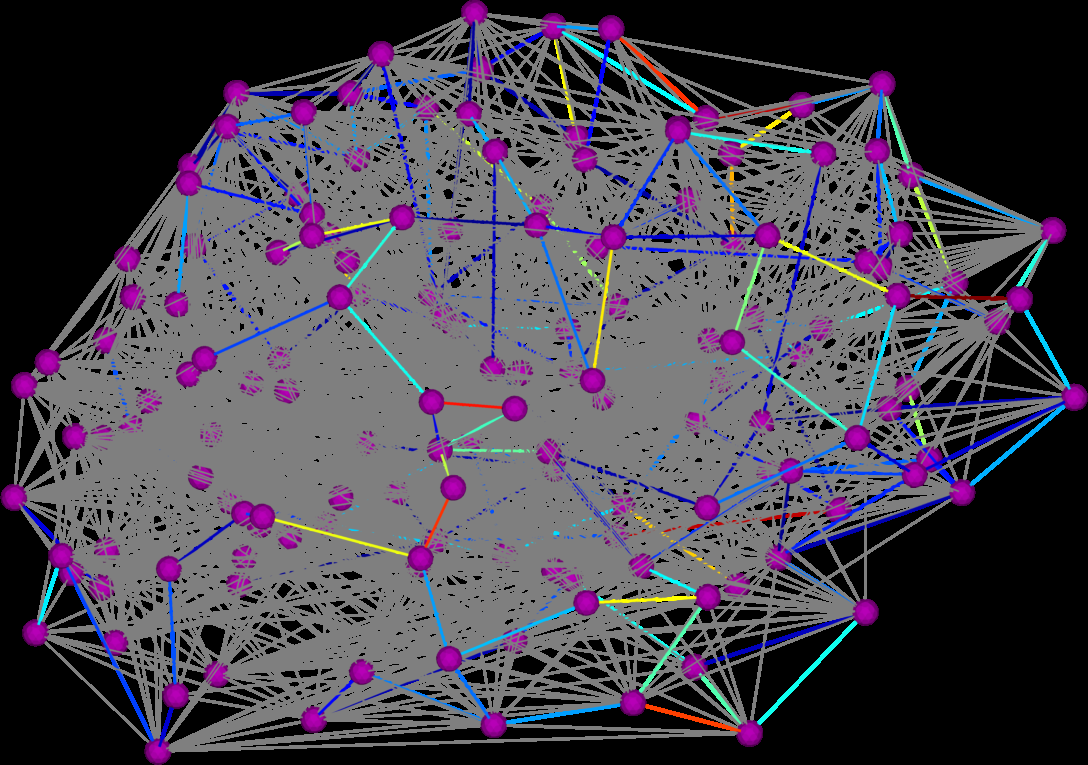
D.K. Hammond, Y. Gur, C.R. Johnson.
“Graph Diffusion Distance: A Difference Measure for Weighted Graphs Based on the Graph Laplacian Exponential Kernel,” In Proceedings of the IEEE global conference on information and signal processing (GlobalSIP'13), Austin, Texas, pp. 419--422. 2013.
DOI: 10.1109/GlobalSIP.2013.6736904
![]()
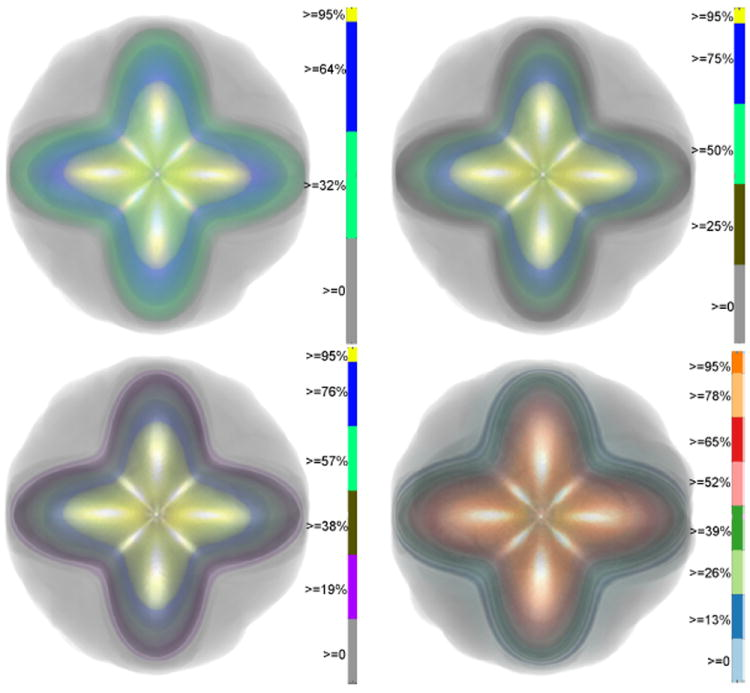
F. Jiao, J.M. Phillips, Y. Gur, C.R. Johnson.
“Uncertainty Visualization in HARDI based on Ensembles of ODFs,” In Proceedings of 2013 IEEE Pacific Visualization Symposium, pp. 193--200. 2013.
PubMed ID: 24466504
PubMed Central ID: PMC3898522
C.R. Johnson, A. Pang (Eds.).
“International Journal for Uncertainty Quantification,” Subtitled “Special Issue on Working with Uncertainty: Representation, Quantification, Propagation, Visualization, and Communication of Uncertainty,” In Int. J. Uncertainty Quantification, Vol. 3, No. 2, Begell House, Inc., pp. vii--viii. 2013.
ISSN: 2152-5080
DOI: 10.1615/Int.J.UncertaintyQuantification.v3.i2
C.R. Johnson, A. Pang (Eds.).
“International Journal for Uncertainty Quantification,” Subtitled “Special Issue on Working with Uncertainty: Representation, Quantification, Propagation, Visualization, and Communication of Uncertainty,” In Int. J. Uncertainty Quantification, Vol. 3, No. 3, Begell House, Inc., 2013.
ISSN: 2152-5080
DOI: 10.1615/Int.J.UncertaintyQuantification.v3.i3
![]()
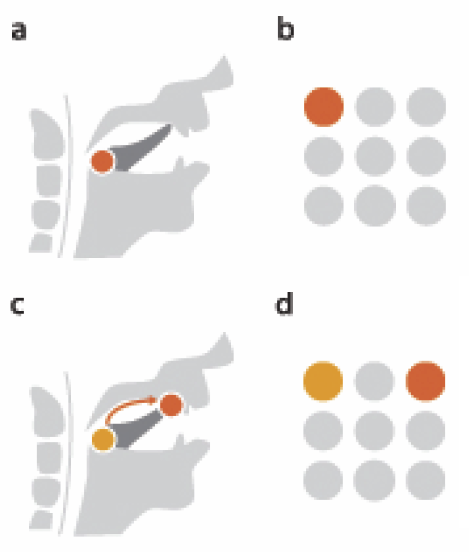
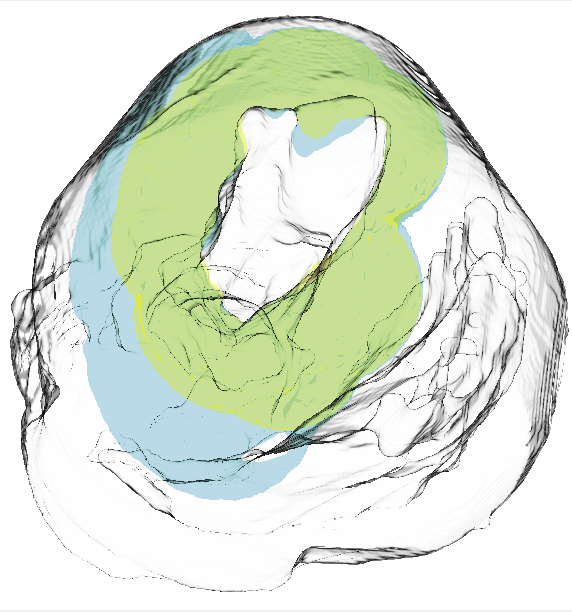
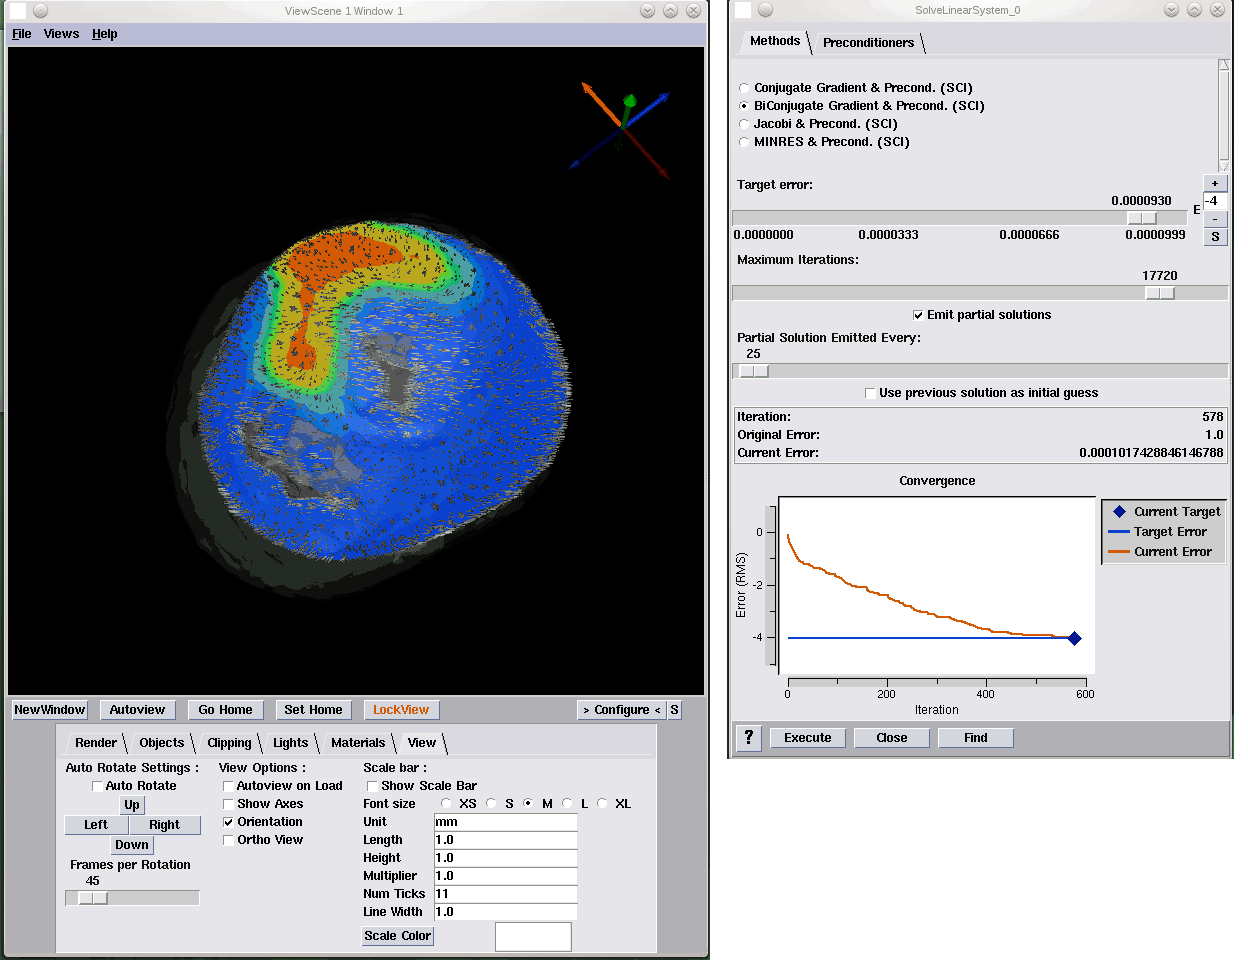
P. Rosen, B. Burton, K. Potter, C.R. Johnson.
“Visualization for understanding uncertainty in the simulation of myocardial ischemia,” In Proceedings of the 2013 Workshop on Visualization in Medicine and Life Sciences, 2013.
![]()
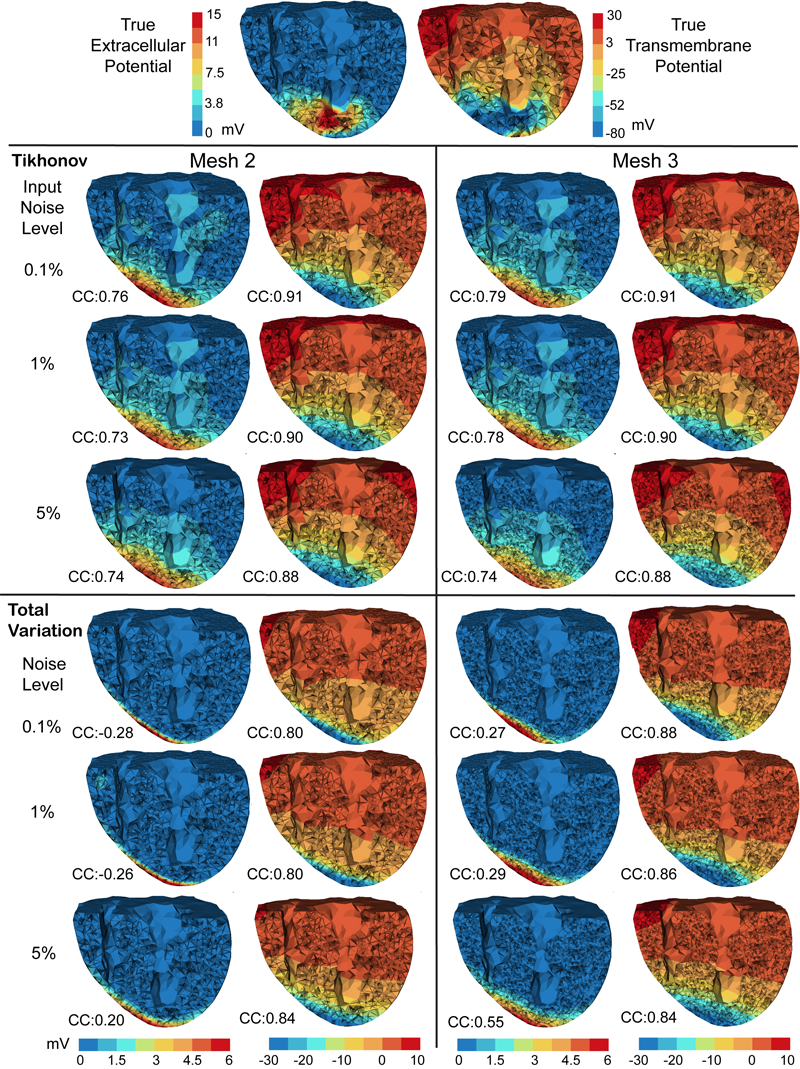
D. Wang, R.M. Kirby, R.S. MacLeod, C.R. Johnson.
“Inverse Electrocardiographic Source Localization of Ischemia: An Optimization Framework and Finite Element Solution,” In Journal of Computational Physics, Vol. 250, Academic Press, pp. 403--424. 2013.
ISSN: 0021-9991
DOI: 10.1016/j.jcp.2013.05.027
Keywords: cvrti, 2P41 GM103545-14
2012
![]()
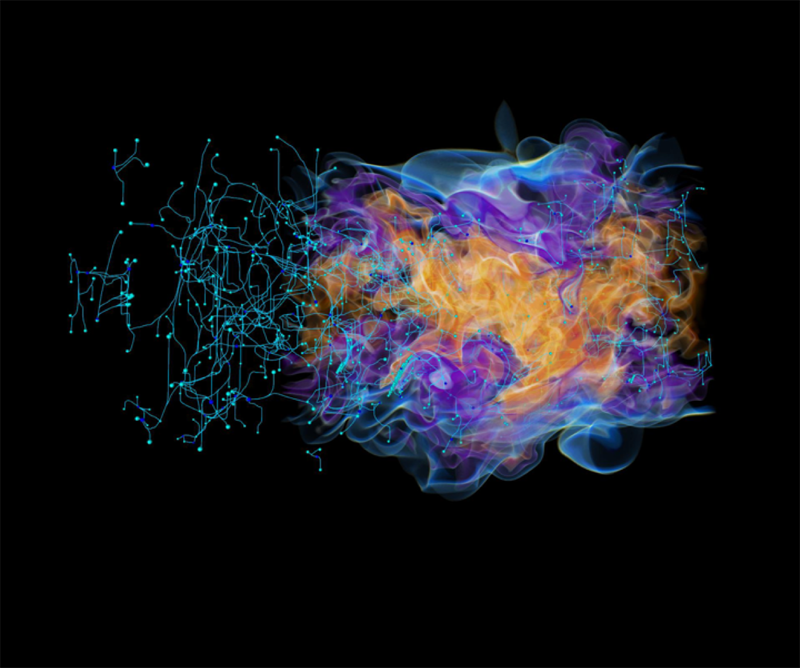
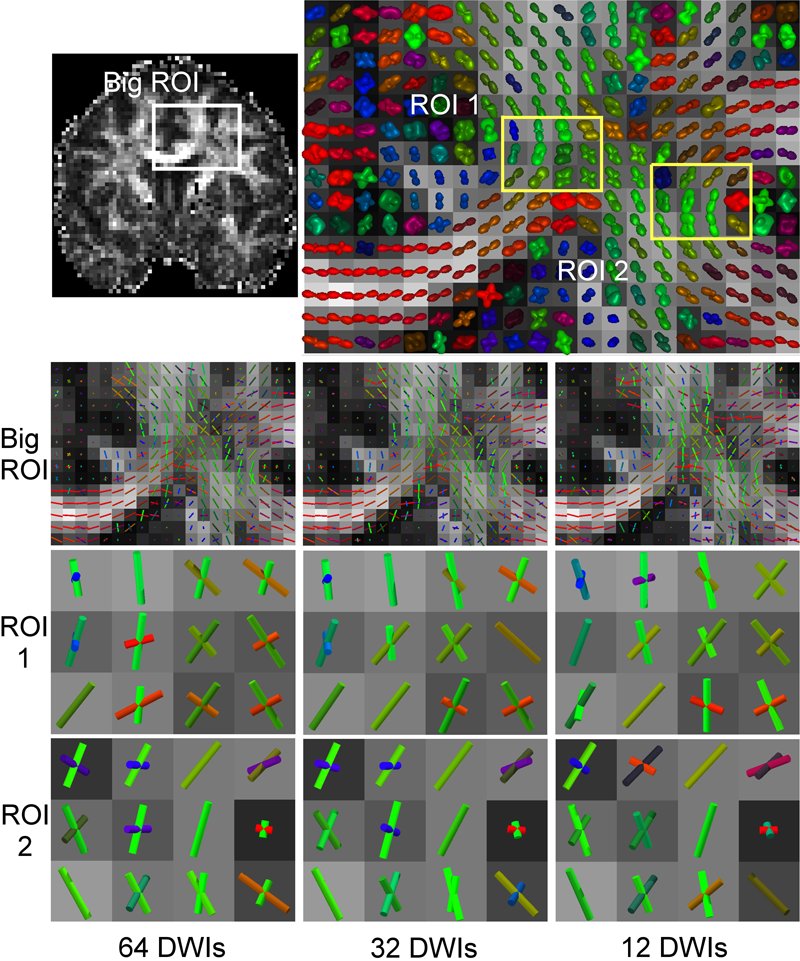
Y. Gur, F. Jiao, S.X. Zhu, C.R. Johnson.
“White matter structure assessment from reduced HARDI data using low-rank polynomial approximations,” In Proceedings of MICCAI 2012 Workshop on Computational Diffusion MRI (CDMRI12), Nice, France, Lecture Notes in Computer Science (LNCS), pp. 186-197. October, 2012.
![]()
C.R. Johnson.
“Biomedical Visual Computing: Case Studies and Challenges,” In IEEE Computing in Science and Engineering, Vol. 14, No. 1, pp. 12--21. 2012.
PubMed ID: 22545005
PubMed Central ID: PMC3336198
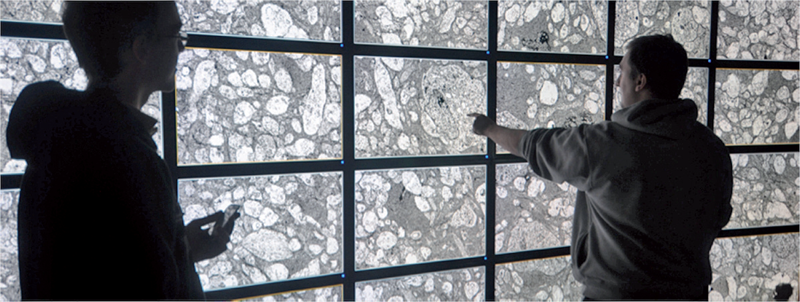
Computer simulation and visualization are having a substantial impact on biomedicine and other areas of science and engineering. Advanced simulation and data acquisition techniques allow biomedical researchers to investigate increasingly sophisticated biological function and structure. A continuing trend in all computational science and engineering applications is the increasing size of resulting datasets. This trend is also evident in data acquisition, especially in image acquisition in biology and medical image databases.
For example, in a collaboration between neuroscientist Robert Marc and our research team at the University of Utah's Scientific Computing and Imaging (SCI) Institute (www.sci.utah.edu), we're creating datasets of brain electron microscopy (EM) mosaics that are 16 terabytes in size. However, while there's no foreseeable end to the increase in our ability to produce simulation data or record observational data, our ability to use this data in meaningful ways is inhibited by current data analysis capabilities, which already lag far behind. Indeed, as the NIH-NSF Visualization Research Challenges report notes, to effectively understand and make use of the vast amounts of data researchers are producing is one of the greatest scientific challenges of the 21st century.
Visual data analysis involves creating images that convey salient information about underlying data and processes, enabling the detection and validation of expected results while leading to unexpected discoveries in science. This allows for the validation of new theoretical models, provides comparison between models and datasets, enables quantitative and qualitative querying, improves interpretation of data, and facilitates decision making. Scientists can use visual data analysis systems to explore \"what if\" scenarios, define hypotheses, and examine data under multiple perspectives and assumptions. In addition, they can identify connections between numerous attributes and quantitatively assess the reliability of hypotheses. In essence, visual data analysis is an integral part of scientific problem solving and discovery.
As applied to biomedical systems, visualization plays a crucial role in our ability to comprehend large and complex data-data that, in two, three, or more dimensions, convey insight into many diverse biomedical applications, including understanding neural connectivity within the brain, interpreting bioelectric currents within the heart, characterizing white-matter tracts by diffusion tensor imaging, and understanding morphology differences among different genetic mice phenotypes.
Keywords: kaust
![]()
J. Knezevic, R.-P. Mundani, E. Rank, A. Khan, C.R. Johnson.
“Extending the SCIRun Problem Solving Environment to Large-Scale Applications,” In Proceedings of Applied Computing 2012, IADIS, pp. 171--178. October, 2012.
Keywords: scirun
![]()
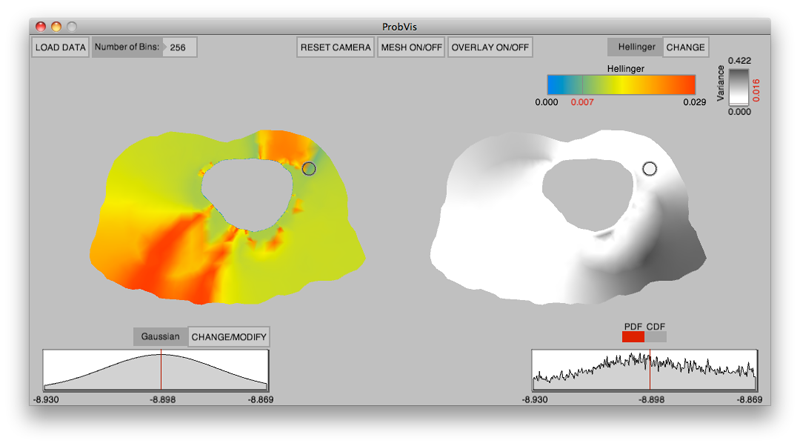
K. Potter, R.M. Kirby, D. Xiu, C.R. Johnson.
“Interactive visualization of probability and cumulative density functions,” In International Journal of Uncertainty Quantification, Vol. 2, No. 4, pp. 397--412. 2012.
DOI: 10.1615/Int.J.UncertaintyQuantification.2012004074
PubMed ID: 23543120
PubMed Central ID: PMC3609671
Keywords: visualization, probability density function, cumulative density function, generalized polynomial chaos, stochastic Galerkin methods, stochastic collocation methods
![]()
K. Potter, P. Rosen, C.R. Johnson.
“From Quantification to Visualization: A Taxonomy of Uncertainty Visualization Approaches,” In Uncertainty Quantification in Scientific Computing, IFIP Advances in Information and Communication Technology Series, Vol. 377, Edited by Andrew Dienstfrey and Ronald Boisvert, Springer, pp. 226--249. 2012.
DOI: 10.1007/978-3-642-32677-6_15
Keywords: scidac, netl, uncertainty visualization
Page 4 of 15