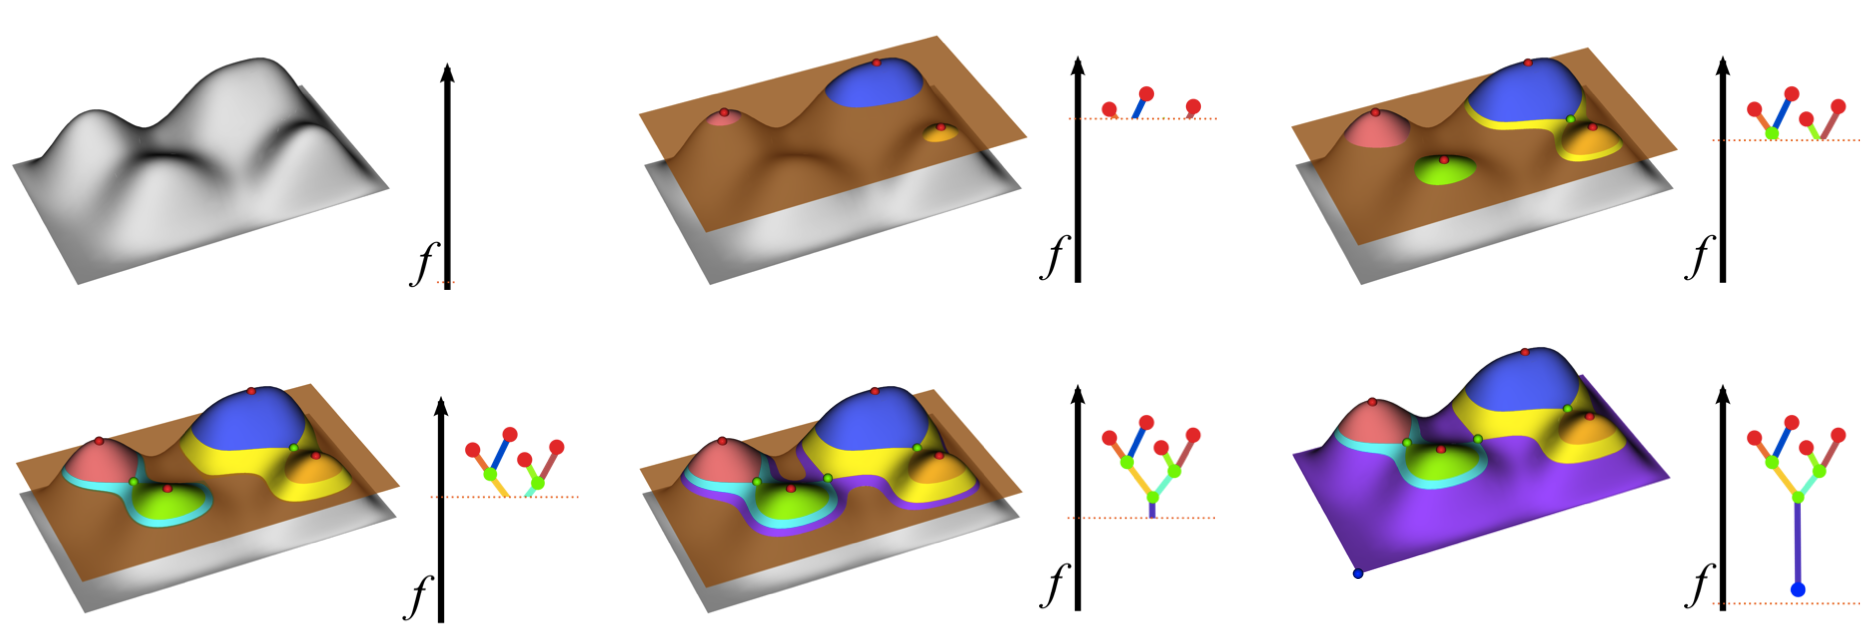
The merge tree encodes the evolution of the connected components of the super-level set of a function defined on a domain as the function range is swept from infinity to negative infinity (as shown above). The merge tree is equivalent to 0-dimensional persistence diagram. Additionally, the geometric descriptions of the super-level sets are often needed for analysis, for example, to determine volumes, shapes, track features, or for visualization. Storing the segmentation along with a merge tree enables the geometric reconstruction of super-level sets during a post-process. Furthermore, access to the segmentation at run-time allows for the pre-computation of various conditional feature-based statistics such as, for instance, average temperatures per feature. Therefore, while the merge tree itself contains only information about the number of features at each threshold, combining the merge tree with its corresponding segmentation creates a powerful and highly flexible analysis tool. We have developed a distributed algorithm for computing the merge tree on a regular CW-complex and identify the key conditions on the regular CW-complex in order to perform this computation.
1. Large Scale Topological Analysis
Distributed Merge Tree Computation Algorithm for Topological Feature Extraction
Project Details
Collaborations
-
Lawrence Livermore National Laboratory
-
PDF
Large Scale Feature Extraction of Scientific Simulations Using Segmented Merge Trees
Project Details
Collaborations
-
Lawrence Livermore National Laboratory
-
Sandia National Laboratory
-
PDF
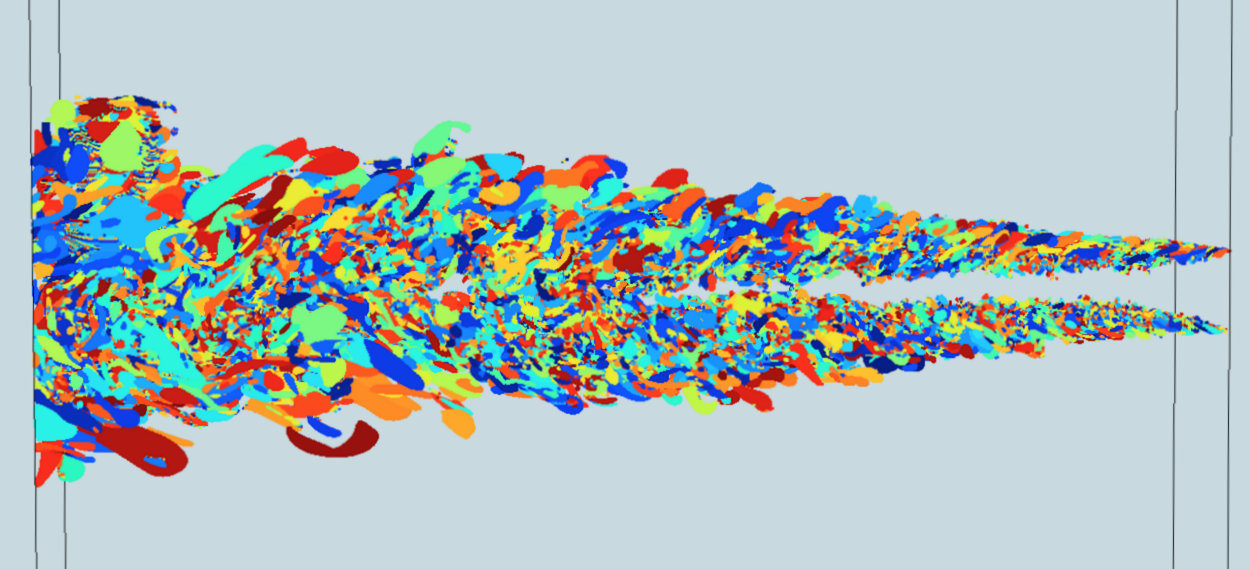
The ever increasing amount of data generated by scientific simulations coupled with system I/O constraints are fueling a need for analysis techniques that can extract features from the data while the simulation is running (in-situ). Of particular interest are approaches that produce reduced data representations while maintaining the ability to redefine, extract, and study features in a post-process to obtain scientific insights. Two variants of in-situ feature extraction techniques using distributed segmented merge trees are presented. The first approach is a fast, low communication cost technique that generates an exact solution but has limited scalability. The second is a scalable, local approximation that nevertheless is guaranteed to correctly extract all features up to a predefined size. We demonstrate both variants using some of the largest combustion simulations available on leadership class supercomputers at full machine scale. Our approach allows state-of-the-art, feature-based analysis to be performed in-situ at significantly higher frequency than currently possible and with negligible impact on the overall simulation runtime.