2012
![]()
C.R. Johnson.
“Biomedical Visual Computing: Case Studies and Challenges,” In IEEE Computing in Science and Engineering, Vol. 14, No. 1, pp. 12--21. 2012.
PubMed ID: 22545005
PubMed Central ID: PMC3336198
Computer simulation and visualization are having a substantial impact on biomedicine and other areas of science and engineering. Advanced simulation and data acquisition techniques allow biomedical researchers to investigate increasingly sophisticated biological function and structure. A continuing trend in all computational science and engineering applications is the increasing size of resulting datasets. This trend is also evident in data acquisition, especially in image acquisition in biology and medical image databases.
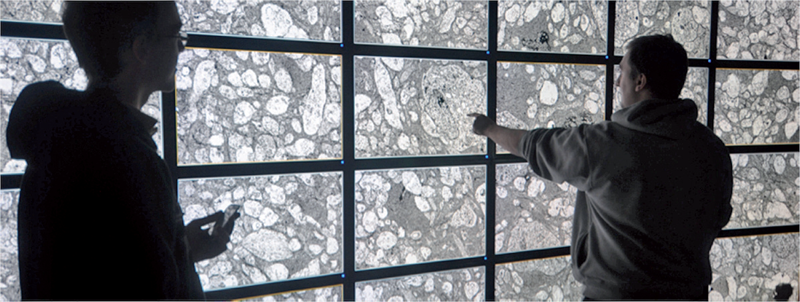
For example, in a collaboration between neuroscientist Robert Marc and our research team at the University of Utah's Scientific Computing and Imaging (SCI) Institute (www.sci.utah.edu), we're creating datasets of brain electron microscopy (EM) mosaics that are 16 terabytes in size. However, while there's no foreseeable end to the increase in our ability to produce simulation data or record observational data, our ability to use this data in meaningful ways is inhibited by current data analysis capabilities, which already lag far behind. Indeed, as the NIH-NSF Visualization Research Challenges report notes, to effectively understand and make use of the vast amounts of data researchers are producing is one of the greatest scientific challenges of the 21st century.
Visual data analysis involves creating images that convey salient information about underlying data and processes, enabling the detection and validation of expected results while leading to unexpected discoveries in science. This allows for the validation of new theoretical models, provides comparison between models and datasets, enables quantitative and qualitative querying, improves interpretation of data, and facilitates decision making. Scientists can use visual data analysis systems to explore \"what if\" scenarios, define hypotheses, and examine data under multiple perspectives and assumptions. In addition, they can identify connections between numerous attributes and quantitatively assess the reliability of hypotheses. In essence, visual data analysis is an integral part of scientific problem solving and discovery.
As applied to biomedical systems, visualization plays a crucial role in our ability to comprehend large and complex data-data that, in two, three, or more dimensions, convey insight into many diverse biomedical applications, including understanding neural connectivity within the brain, interpreting bioelectric currents within the heart, characterizing white-matter tracts by diffusion tensor imaging, and understanding morphology differences among different genetic mice phenotypes.
Keywords: kaust
2010
![]()
J.R. Anderson, B.C. Grimm, S. Mohammed, B.W. Jones, T. Tasdizen, J. Spaltenstein, P. Koshevoy, R.T. Whitaker, R.E. Marc.
“The Viking Viewer: Scalable Multiuser Annotation and Summarization of Large Volume Datasets,” In Journal of Microscopy, Vol. 241, No. 1, pp. 13--28. 2010.
DOI: 10.1111/j.1365-2818.2010.03402.x