
Top Scientific Visualization Research Problems
 Scientific visualization as currently understood and practiced is still a relatively new discipline. As a result, we visualization researchers are not necessarily accustomed to undertaking the sorts of self-examinations that other scientists routinely undergo in relation to their work. Yet if we are to create a disciplinary culture focused on matters of real scientific importance and committed to real progress, it is essential that we ask ourselves hard questions on an ongoing basis. What are the most important research issues facing us? What underlying assumptions need to be challenged and perhaps abandoned? What practices need to be reviewed? In this article, I attempt to start a discussion of these issues by proposing a list of top research problems and issues in scientific visualization. [PDF version]
CT Segmentation and 3-D Reconstruction with Morphometric Analysis for Evaluation of Occipital-Cervical Instability in Children
Down syndrome is a common chromosomal disorder that affects 0.15 percent of the total population. Individuals with Down syndrome are prone to spinal instability due to congenital abnormalities in the occipital-cervical (O-C1) joint near the base of the skull. To determine the possible abnormality causing this instability, an image-processing pipeline was created by combining several available software packages and custom made software. Patients with Down syndrome and spinal instability at the O-C1 joint were age-matched with controls. The subject data was assessed and a congenital abnormality was defined in the superior articular facets of C1 in the Down syndrome patients. The software developed helped to visualize the abnormality and could be used in a clinical setting to help aide in the diagnosis and screening for spinal instability in Down syndrome patients.
SCI Institute Welcomes New Faculty
 Mike Kirby joins us from Brown University.The focus of his research focus deals with large- scale scientific computing and visualization, with an emphasis on the scientific cycle of mathematical modeling, computation, visualization, evaluation, and understanding. His primary research interests are: Computational Science and Engineering, Concurrent Programming, Scientific Visualization, Interdisciplinary Collaboration across Computer Science, Engineering, Applied Math, Computational Steering, and High Performance Computing.
Martin Berzins joins us from the University of Leeds where he is also Professor of Scientific Computing, Co-director of the Computational PDEs Unit, and head of the Scientific Computing and Visualization research group. His primary interests are in the fields of Adaptive Numerical Methods and software, Unstructured Tetrahedral Meshes, Reacting Flows, Time Dependent PDEs, Parallel Algorithms, and Computational Fluid and Solid Mechanics Applications.
Visualization of Vortex Flow Structures in Aerodynamics Applications
Computational Fluid Dynamics (CFD) has become an essential tool in various engineering fields. In aeronautics it is a key element in the design of modern aircrafts. The performances of today's computers combined with the increasing complexity of physical models yields numerical simulations that accurately reproduce the flow structures observed in practical experiments and permit to study their impact on flight stability. Yet, to fully exploit the huge amount of information contained in typical data sets engineers require powerful post-processing techniques that allow insight into the results of their large-scale computation.
Flow visualization aims at addressing this challenge by offering intuitive and effective depictions of interesting flow patterns. Unfortunately, many problems remain that limit the usefulness of existing methods in practical applications. Our recent work has focused on the design of new visualization techniques suitable for large-scale CFD simulations. Special emphasis was put on critical flight situations that lead to turbulent and vortical flows as well as complex and structurally involved phenomena like flow recirculation and vortex breakdown.
Visualization of Anatomic Covariance Tensor Fields
The computation, visualization, and interpretation of brain variability remains a significant challenge in computational neuroanatomy. Current deformable registration methods can generate, for each vertex of a polygonal mesh modeling the cortical surface, a distribution of displacement vectors between the individual models and their average, which can be summarized as a covariance tensor. While analysis of anatomical covariance tensor fields promises insight into the structural components of aging and disease, basic understanding of the tensor field structure is hampered by the lack of effective methods to create informative and interactive visualizations. We describe a novel application of superquadric tensor glyphs to anatomic covariance tensor fields, supplemented by colormaps of important tensor attributes. The resulting visualizations support a more detailed characterization of population variability of brain structure than possible with previous methods, while also suggesting directions for subsequent quantitative analysis.
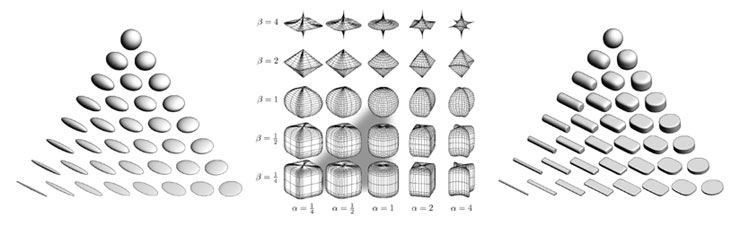 Figure 1: (a) Ellipsoid tensor glyphs, (b) Space of superquadrics, (c) Superquadric tensor glyphs. Ellipsoidal glyphs (a) suffer from visual ambiguity. The range of superquadrics (b) used for tensor glyphs is highlighted with the gray triangle. Superquadric glyphs (c) differentiate shape and convey orientation more clearly than do ellipsoids. Figure 1: (a) Ellipsoid tensor glyphs, (b) Space of superquadrics, (c) Superquadric tensor glyphs. Ellipsoidal glyphs (a) suffer from visual ambiguity. The range of superquadrics (b) used for tensor glyphs is highlighted with the gray triangle. Superquadric glyphs (c) differentiate shape and convey orientation more clearly than do ellipsoids. |
Interactive Point Based Isosurface Extraction
We have proposed a novel point-based approach to view dependent isosurface extraction. We also introduce a fast visibility query system for the view dependent traversal, which exhibits moderate memory requirements. Using this technique, we achieved an interactive interrogation of the full visible woman dataset (1GB) at more then four frames per second on a desktop computer. The point-based approach is based on an extraction scheme that classifies different sections of the isosurface into four categories. The classification is based on the size of the geometry when projected onto the screen. In particular, we use points to represent small and sub-pixel triangles, as well as large sections of the isosurface whose projection has sub-pixel size. An important issue raised by point-based processing is how to assign a normal to an isolated point representing a large, but far, section of the isosurface. We propose to define such normals during a post processing of the extracted isosurface and provide the corresponding hardware implementation.
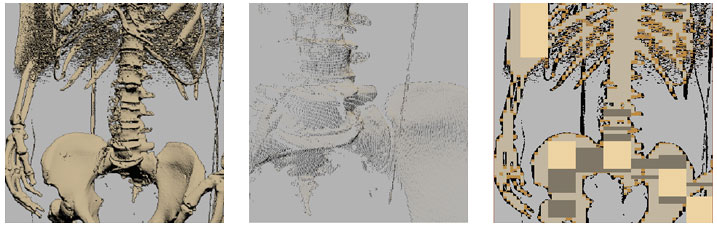 Figure 1: Left: A section of the visible female skeleton. Middle: A closeup view of the extracted points. Right: The final visibility mask. The color represent different levels of the mask hierarchy Figure 1: Left: A section of the visible female skeleton. Middle: A closeup view of the extracted points. Right: The final visibility mask. The color represent different levels of the mask hierarchy |
BioTensor: Visualizing Diffusion Tensor MRI
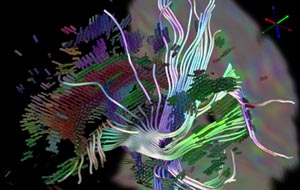 Diffusion tensor MRI visualization is a growing field of research. The scanners are collecting better data all the time, and doctors and scientists are constantly discovering new applications for this data. However, unlike scalar and vector data, high-dimensional tensors are not always intuitive to visualize. When devising new strategies for DT-MRI visualization, it is important to understand both what exactly it is that is being measured and what insights the doctors and scientists are hoping to gain from the data.
The success of diffusion magnetic resonance imaging (MRI) is deeply rooted in the powerful concept that during their random, diffusion-driven displacements, molecules probe tissue structure at a microscopic scale well beyond the usual image resolution. As diffusion is truly a three dimensional process, molecular mobility in tissues may be anisotropic, as in brain white matter. With diffusion tensor imaging (DTI), diffusion anisotropy effects can be fully extracted, characterized, and exploited, providing even more exquisite details on tissue microstructure. The most advanced application is certainly that of fiber tracking in the brain, which, in combination with functional MRI, might open a window on the important issue of connectivity. DTI has also been used to demonstrate subtle abnormalities in a variety of diseases (including stroke, multiple sclerosis, dyslexia, and schizophrenia) and is currently becoming part of many routine clinical protocols.
Scientific Visualization in Small Animal Imaging
Biomedical applications of small animal imaging are creating exciting opportunities to extend the scientific impact of visualization research. Specifically, the effective pairing of non-linear image filtering and direct volume rendering is one strategy for scientists to quickly explore and understand the volumetric scans of their specimens. Microscopic computed tomography imaging is an increasingly popular and powerful modality for small animal imaging. Here we highlight early work from collaborations at the University of Utah between the Scientific Computing and Imaging (SCI) Institute and the Department of Bioengineering, and between the SCI Institute and the Division of Pediatric Hematology-Oncology in the Department of Pediatrics. In the first instance, volume rendering provides information about the three-dimensional configuration of an electrode array implanted into the auditory nerve of a feline. In the second instance, volume rendering shows promise as a tool for visualizing bone tissue in the mouse embryo, although the signal-to-noise characteristics of the data require the use of sophisticated image pre-processing.
The data for both of these investigations was acquired with a General Electric EVS RS-9 computed tomography scanner at the University of Utah Small Animal Imaging Facility. The scanner generates 16-bit volumes roughly one gigabyte in size, with a spatial resolution of 21 x 21 x 21 microns.