Every Breath You Take
Shortening Treatment for Lung Cancer Patients
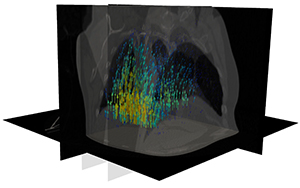 New research at the Scientific Computing and Imaging Institute at the University of Utah, helps to precisely target tumors in lung cancer patients using artificial intelligence. Employing algorithms developed by Sarang Joshi, DSc, professor of Biomedical Engineering and graduate student Markus Foote in collaboration with Amit Sawant, PhD, at the University of Maryland, Baltimore, and radiation oncologists will be able to predict movement in lung tumors as the patient breathes in real-time with a 3D motion model.
What you can’t see can hurt you
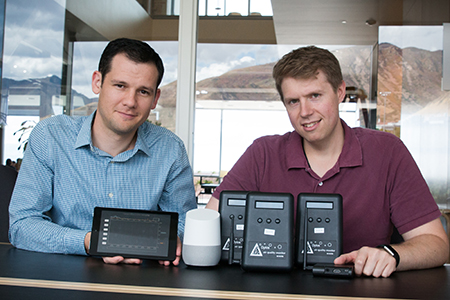 You can't see nasty microscopic air pollutants in your home, but what if you could?
Engineers from the University of Utah's School of Computing conducted a study to determine if homeowners change the way they live if they could visualize the air quality in their house. It turns out, their behavior changes a lot.
Contributions to Computer Graphics
By Paul Gabrielsen, science writer, University of Utah Communications
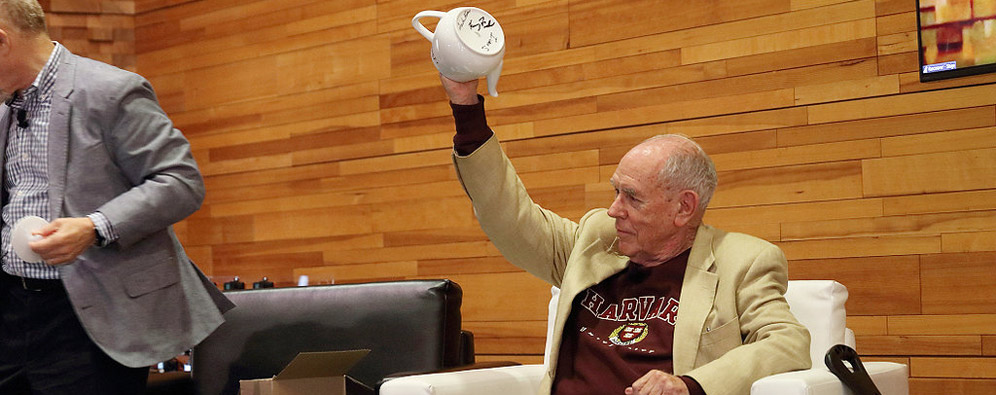
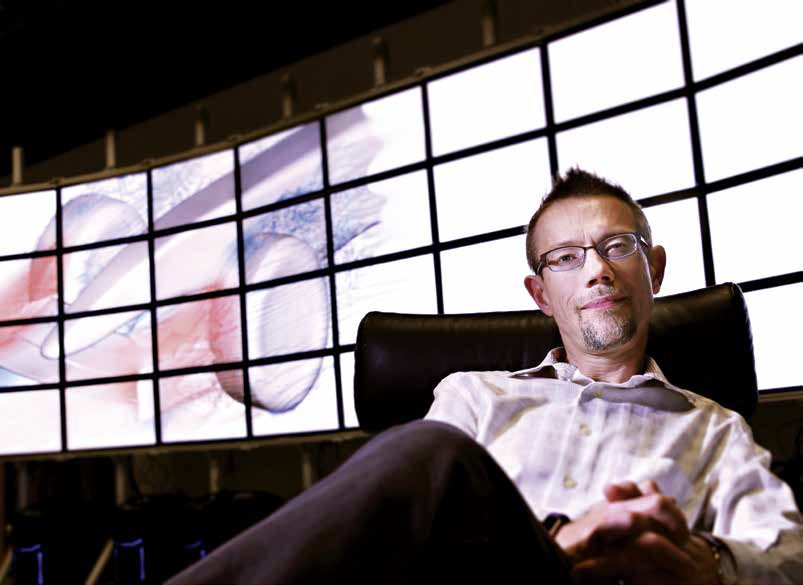
On Monday, August 13, the computer graphics world honored 52 people as inaugural members of the SIGGRAPH Academy. Each played a role in bringing graphics from their beginnings as arrangements of glowing lines to the immersive 3D worlds that moviemakers, game designers and others build today. Seven of those 52 were alumni of the University of Utah. And one was the "father of computer graphics," former professor Ivan Sutherland.
At the Hayden Planetarium, a Joyride Across the Cosmos
Story appears at the New York Times
 Carter Emmart used to want to go to space. Now he does, all the time — but virtually. And he likes to share.
On a recent afternoon, he took a visitor at the Hayden Planetarium, where he works, on a kind of joyride across the known universe. The lights dim. The inverted bowl of the planetarium’s screen comes to life. But the familiar, insectlike projector that displays the stars and constellations is stowed under the floor. Instead, projectors are reconstructing images onto the half dome from a desktop computer.
So there’s Mars, filling the screen, its reddish desert revealed as a landscape of mountains and valleys that make the Grand Canyon look like a puny arroyo. Flying around, we take in the sights, the surroundings uncannily close and detailed, so that boulders only a few feet across can be discerned.
Targeting Tumors More Accurately
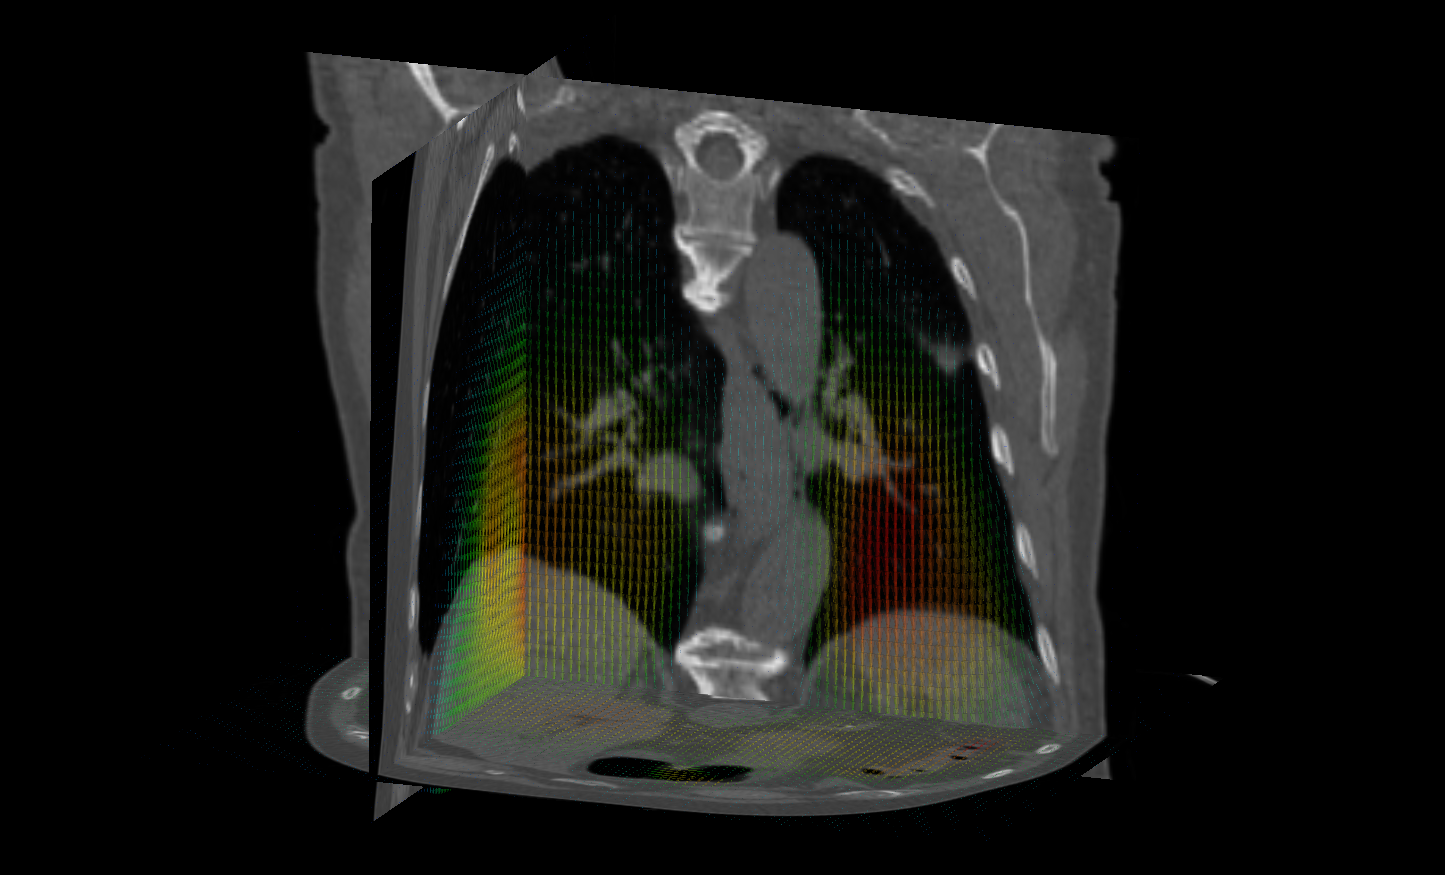 New research being conducted at the Scientific Computing and Imaging Institute holds the potential to increase the accuracy of targeted treatments for tumors in the lungs. Currently, motion caused by the patient's breathing introduces motion artifacts when imaging lung tumors. The inherent breathing motion also limits the precise targeting of radiation therapy for treating lung cancer.
Nothing is Certain
 "The only certainty...," it is said, "is that nothing is certain."
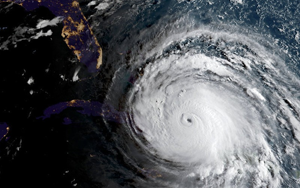
And so it goes with computational forecasts of important events such as weather, finance, and climate. Among all of this uncertainty, however, there are patterns, likelihoods, and rarities that inform important decisions that may affect billions of dollars in resources and thousands, or even millions, of lives. In the hurricane season on the eastern U.S., computational forecasting plays a central role in critical decisions that can determine allocations of emergency resources and the movements of people. The uncertainty and accuracy of these forecasts is an important part in making effective use of these sophisticated tools.
Need for Speed
 Whether it’s coming up with the best design for a Formula 1 race car or understanding the effects of atrial fibrillation on the heart, developing the right simulation model for research sometimes involves equal parts applied math, engineering and computer science.
University of Utah School of Computing professor Mike Kirby sees himself as the person who connects these disciplines so he can take trailblazing ideas and help create better simulation software to aid researchers.
Gigapixel image analysis on the fly
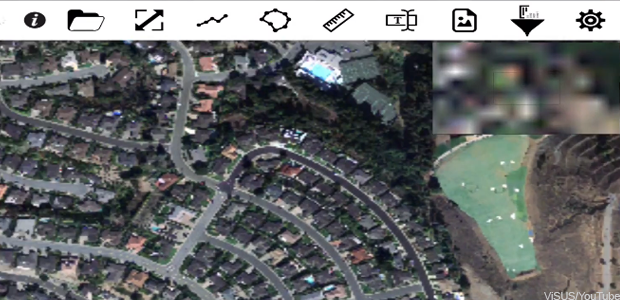 Most farmers probably never thought they'd be in the market for a way to process huge digital images more quickly -- until, that is, inexpensive drones with high-resolution cameras gave them access to images they could use to micromanage irrigation and to detect the growth of crop-threatening diseases.
Visualizing Hurricanes
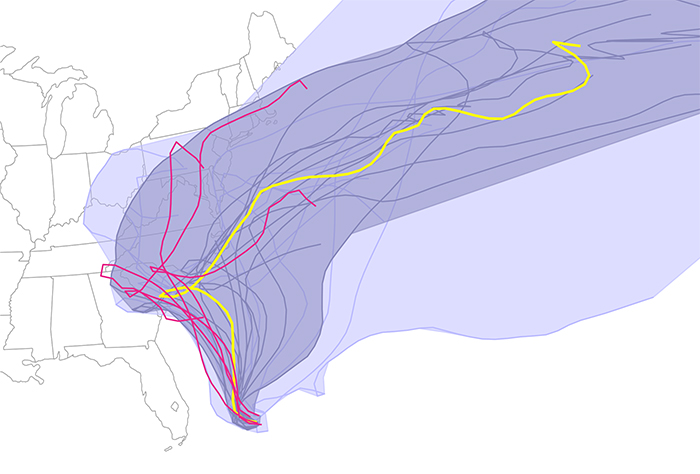 |
| The results denoted possible predicted paths, based upon different models and/or conditions Joaquin might take as of Friday October 2, 2015. Using their Curve Boxplot analysis and visualization method, they show the median hurricane path and the 50 percent band (dark region) — denoting the spatial swath in which 50 percent of the predicted hurricane tracks lie. The light band denotes nearly 100 percent of the possible paths predicted. Red denotes outliers — those hurricane paths flagged as unlikely in reference to all other members of the ensemble. |
Understanding the Morphology of Brain Disorders
Advances in medical imaging devices, such as magnetic resonance imaging (MRI), have led to our ability to acquire detailed information about the living human brain, including its anatomical structure, function, and connectivity. However, making sense of this complex data is a difficult task, especially in large imaging studies that may include hundreds or even thousands of participants. This is where computer science can play an important role. Image analysis algorithms can automatically quantify properties of the brain, such as the size of brain structures, or the functional activity in different brain regions. This provides neuroscience researchers with insights into how the brain functions and what abnormalities are present in diseased brains.
Evolution of the Medical Classroom
 Introducing ViSOAR. As data acquisition advances, and data sizes increase, the need for tools to process and visualize the results in an effective and efficient manner is becoming increasingly important. The reliance on supercomputers for scientific visualization and analysis is already proving to be a hindrance for wide accessibility to researchers and scientists dealing with large data.
The Scientific Computing and Imaging (SCI) Institute and the Center for Extreme Data Management, Analysis, and Visualization (CEDMAV), in collaboration with ARUP Laboratories and the University of Utah, Department of Neurobiology and Anatomy, have developed ViSOAR--a multi platform visualization application for accessing and processing very large imaging data.
Solving Mysteries of Autism via The Power of Collaboration
Dr. Guido Gerig Early-Brain Development Research Reveals Vibrant Clues
By Peta Owens-Liston
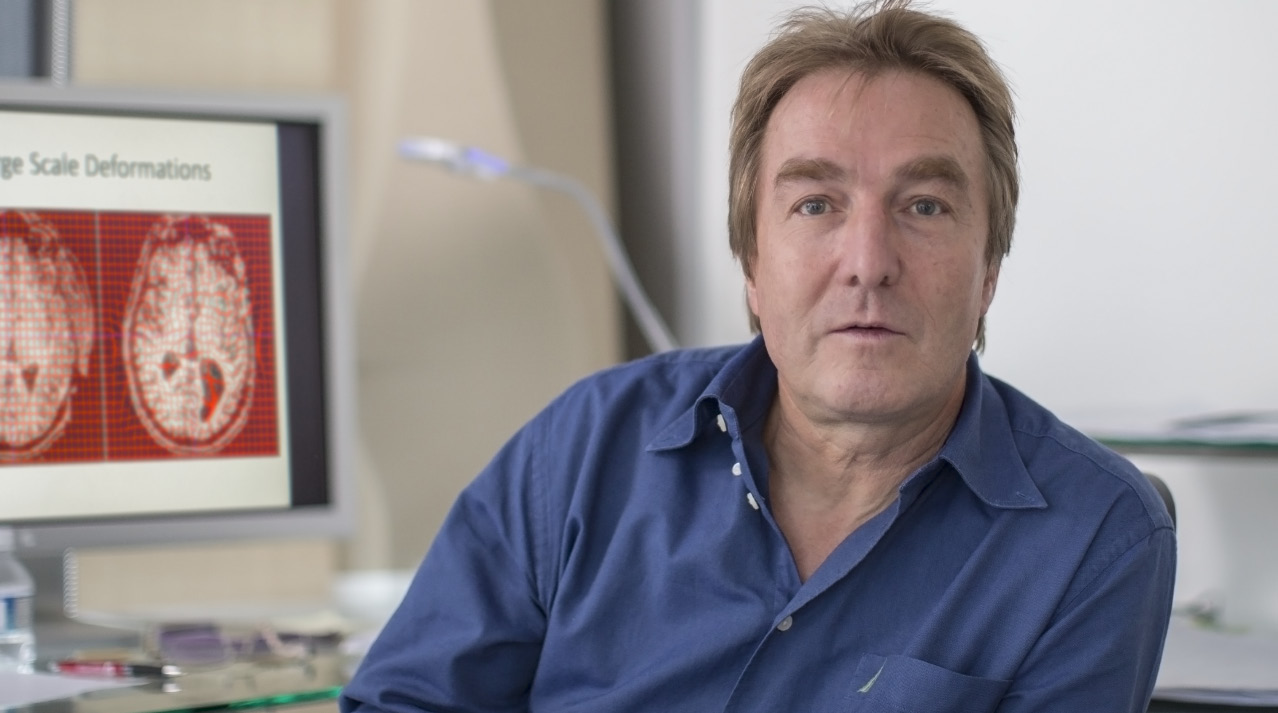 |
| Dr. Guido Gerig |
Pencil in hand, Gerig fills three pages with a whirl of sketches as he explains how his imaging work illuminates clinical findings in his research involving early brain development, and more specifically autism. The sketches fade to stick figure-status as Gerig jumps back and forth between the paper and the color-exploding images on his computer screen. Vivid and seemingly pulsating with life, the brain-development images are a result of thousands of highly precise, quantifiable measurements never before captured visually.
Mobile Mayhem: Researchers Harness Kraken to Model Explosions via Transport
by Gregory Scott Jones - NICS
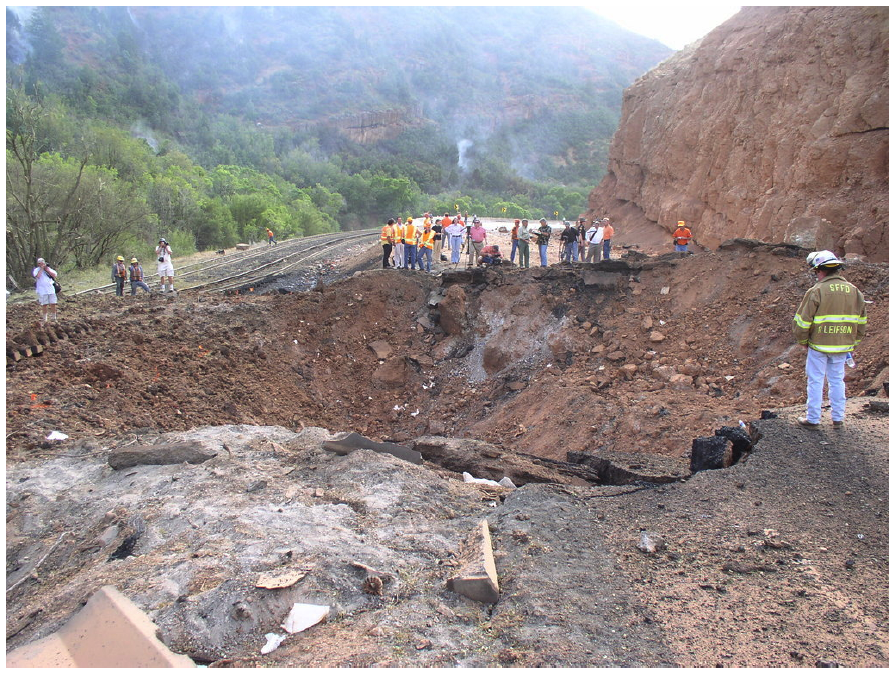 |
| The crater resulting from the Spanish Fork Detonation. |
Now, the good news: America's track record in transporting these materials is about as safe as they come. Very rarely, almost never in fact, are the potential dangers of these transports realized, largely due to instituted safeguards that seem to work very well.
However, accidents can happen. Take the August 2005 incident in Spanish Fork Canyon, Utah, for instance. A truck carrying 35,500 pounds of explosives—specifically small boosters used in seismic testing—overturned and exploded, creating a crater in the highway estimated to be between 20 to 35 feet deep and 70 feet wide according to the Utah Department of Transportation. But the damage wasn't solely financial. Four people, including the truck driver and a passenger, were hospitalized.
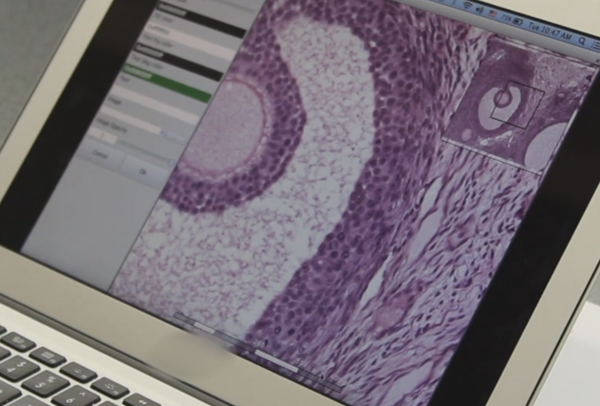
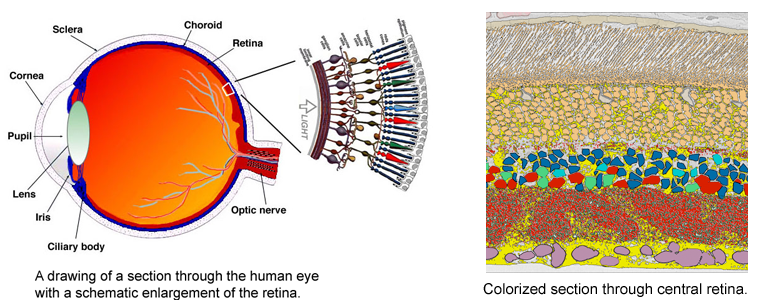
CRCNS: Fighting Blindness
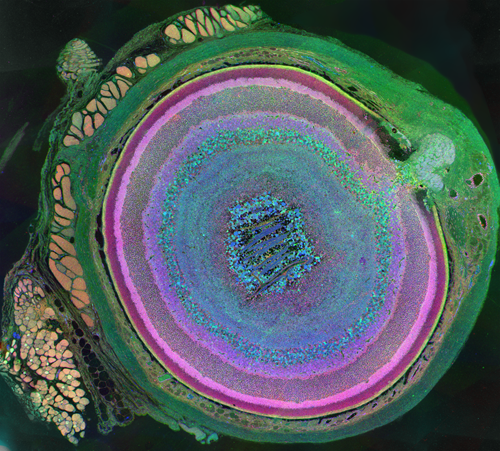 Despite great advances in neuroscience and medical technology in recent decades, nearly ten million Americans still suffer blindness due to retinal degenerative diseases such as retinitis pigmentosa (RP), age-related macular degeneration (AMD), diabetic retinopathy, and glaucoma. Unfortunately, current treatments available for these conditions are still quite limited. A primary challenge to developing effective treatments is the need for a complete understanding of the highly complex and delicate systems that compose the retina and how those systems change in response to degenerative disorders.
Remodeling processes that occur in the neuronal pathways within the retina during the course of retinal deterioration are of particular importance to the development of treatments for these conditions. Researchers at the Robert E. Marc Laboratory at the Moran Eye Center are collaborating with the SCI Institute on a project supported by the NIH-NIBIB (grant number 5R01EB005832) to develop high-throughput techniques for reconstructing and visualizing the neural structures that compose the retina in order to meet these challenges.
Scientific Background
Building a Better Brain Atlas
 In 1909 the Broadman areas map was published which localized various functions of cortex. |
Although we've identified many structures and characteristics that are common in all human brains, in reality every brain is different and we need to improve our understanding of how brains vary between individuals. One problem that persists is that most current atlases have been based on arbitrarily chosen individuals. Even today, when intense research has been directed toward the development of digital three-dimensional atlases of the brain, most digital brain atlases so far have been based on a single subject's anatomy. This introduces a bias into the analysis when comparing individual brains to the atlas and does not provide a meaningful baseline with which to measure individual anatomical variation.
VisTrails: A New Paradigm for Dataflow Management
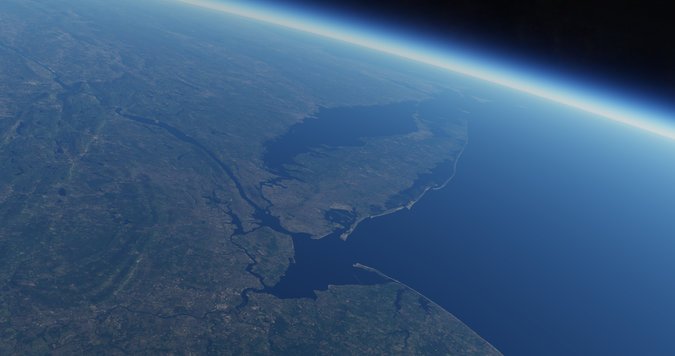
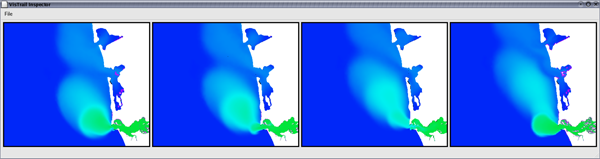 Figure 1: The VisTrails Visualization Spreadsheet. Surface salinity variation at the mouth of the Columbia River over the period of a day. The green regions represent the fresh-water discharge of the river into the ocean. A single vistrail specification is used to construct this ensemble. Each cell corresponds to a single visualization pipeline specification executed with a different timestamp value. |
The Mechanics of Angiogenesis
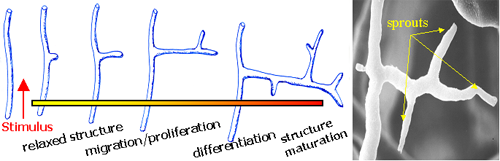 Growth of new blood vessels from existing ones. |
The Center for Interactive Ray-Tracing and Photo Realistic Visualization
Almost every modern computer comes with a graphics processing unit (GPU) that implements an object-based graphics algorithm for fast 3-D graphics. The object-based algorithm in these chips was developed at the University of Utah in the 1970s. While these chips are extremely effective for video games and the visualization of moderately sized models, they cannot interactively display many of the large models that arise in computer-aided design, film animation, and scientific visualization. Researchers at the University of Utah have demonstrated that image-based ray tracing algorithms are more suited for such large-scale applications. A substantial code base has been developed in the form of two ray tracing programs. The new Center aims to improve and integrate these programs to make them appropriate for commercial use.
CT Segmentation and 3-D Reconstruction with Morphometric Analysis for Evaluation of Occipital-Cervical Instability in Children
Down syndrome is a common chromosomal disorder that affects 0.15 percent of the total population. Individuals with Down syndrome are prone to spinal instability due to congenital abnormalities in the occipital-cervical (O-C1) joint near the base of the skull. To determine the possible abnormality causing this instability, an image-processing pipeline was created by combining several available software packages and custom made software. Patients with Down syndrome and spinal instability at the O-C1 joint were age-matched with controls. The subject data was assessed and a congenital abnormality was defined in the superior articular facets of C1 in the Down syndrome patients. The software developed helped to visualize the abnormality and could be used in a clinical setting to help aide in the diagnosis and screening for spinal instability in Down syndrome patients.
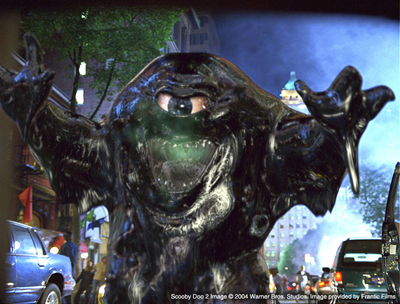
Level-Set Metamorphosis Goes Hollywood