 |
This document describes the function and usage of the program map3dgl, a scientific visualization application used at the CVRTI to view model geometry and scalar (potential) and vectors (current) field distributions. The program is highly interactive and makes extensive use of the full VGX features of the Silicon Graphics Library (GL). map3dgl is a program written in C using the SGI GL library for interactive display of both geometry and data assigned to elements of that geometry on the Silicon Graphics 4D/210 VGX workstation. The program can read multiple surfaces, each with multiple associated potential/current data files.
  map3d [-b -iv -ss -v -vm -nw\
         -c  default_mesh_colour \
         -df default_filename \
         -if default_image_filename \
         -dp datafile_pathname \
         -gp geomfile_pathname \
         -rl report_level \
         -vw xmin ymin ]
         -f geomfilename \
         [-ac \
         -as xmin xmax ymin ymax \
         -at xmin xmax ymin ymax
         -c colour \
         -cg colour \
         -ds \
         -dp datafile_pathname \
         -gp geomfile_pathname \
         -lm landmark_filename \
         -p potfilename -s num1 num2 -i increment \
         -ph maxpotval -pl minpotval \
         -cs contour-spacing \
         -ps scaling_value \
         -ll leadlinks-filename \
         -cl channels-filename \
         -sl surfnum \
         -t trace-lead-number ]
Typical cases of usage of map3dgl are given below:
map3d -nw -f datfilename.data
The -nw option sets a new window for each surface of data. A
modification of this if the number of the data series is known in
advance is
map3d -f datfilename.data@seriesnum
This would load the series seriesnum from the file datfilename.data and place all surfaces in a single window.
map3d -w -f geomfilename.geom -p datfilename.data
This overrides the geometry file specified in the header of the
.data file. The same modification as above is permitted here -- if
the specific series number is already known, use the form
map3d -w -f geomfilename.geom -p datfilename.data@seriesnum
This reads series seriesnum from datfilename.data and
displays it on the geometry from geomfilename.geom.
map3d -w -f geomfilename.geom@surfnum -p datfilename.data
which specifies that surface surfnum is to be read from the
geometry file and that only data associated with this surface will
be read from the data file datfilename.data. Here too the
option of explicitly specifying the series number is provided. For
example,
map3d -w -f geomfile.geom@surfnum -p datfile.data@seriesnum
would read geometry from surface surfnum and data for that
surface from series seriesnum of the file datfilename.data. In this mode, all the surface based attributes
described below (e.g., colours, window locations, first and last
frame numbers of the data, etc. can be specified at startup
time.
Note that if the series number is not specified at startup, the user is presented with a file box from which the desired series is selected. Likewise, if the frame numbers are not given in the command line, the user is presented with a power curve in which to window the data to be displayed. See section 4.3.2 for more information in how to access .data files.
The following general parameters affect the entire display:
For each new surface, a subset of the following surface-specific parameters may be used. Note that if these parameters are to be used with data that are read from .data or .geom files, the last of the three forms specified in section 2.1 above must be used. Otherwise, all surfaces are read at once and the user must accept the default settings for each surface.
| 1 = red | 4 = cyan |
| 2 = green | 5 = magenta |
| 3 = blue | 6 = yellow |
| 7 = white |
| 1 = red | 4 = cyan |
| 2 = green | 5 = magenta |
| 3 = blue | 6 = yellow |
| 7 = white |
For each set of potentials on the surface:
-s option is used, a
number and the extensions .pot for potential and
.grad for currents will be append to this base filename
(see -s option), for .data files, the -s option
specifies the frame numbers to be read from the file. Otherwise
singles .pot or .grad files named
potfilename.pot and potfilename.grad will be
searched and read in, or the user will have to interactively
specify the run number and frame numbers to be read from the .data
file. If a specific run of a .data file is desired, append the run
number N in the form ``@N to the end of the filename, e.g.,
-p datafile.data@4 to read run number 4 from the file
datafile.data (see section 2.1).
-p lux_map -s 1 6 -i 2
lux_map001.pot lux_map003.pot lux_map005.pot
For .data files, the frames are read with an increment of increment from the file.
In this section, we highlight the latest additions to map3dgl in the (vain?) hope that people will read at least this much of the manual and be able to quickly make use of the latest and greatest that the program offers.
Added a description of the frame controls in Section 6.3.
Also renamed the program to map3dgl to indicate the transition of the original program to OpelGL.
Well, I have a new feature in Map3d for you to play with. This is the option tnat allow you to specify intervals between contours at the command line when starting map3d. Not the final functionality we want, but at least a start and something we can experiment with.
The option is called
-\texttt{cs value}
cs stands for "contour step" and value is a numeric value in the same units as the scalar data you are viewing.
So a map3d command might look like
map3d -f daltorso.geom -p dipole2.data -cs 5
for contour spacing of 5 units.
You can still use all the other contour options and have two places to select or deselect the values in the -cs option. Look in the "Scaling Model" and the "Number of Contours" menus for these controls.
The logic for -cs spacing I have implemented (and this is subject to discussion) for the different scale mapping is as follows:
At least this is how it is supposed to work (-:
Still to do:
Some new features in a little more detail:
A small sampler of things that are in the works:
The program map3dgl looks for files containing default settings for virtually all parameters that are relevant to the control of the program. The order of precedence is as follows:
The format of the default file is as follows:
           # comment line (ignored by map3d)
           parameter = value
where the parameters and values are taken from the following list:
| Parameter | Values | Meaning |
| shadingmodel | GOURAUD | Use Gouraud shading of triangles |
| FLAT | Use flat shading of triangles | |
| scale_scope | GLOBAL_SURFACE | Scaling global over each surface |
| GLOBAL_FRAME | Scaling global over each frame of data | |
| GLOBAL_GLOBAL | Scaling global over all data | |
| LOCAL | Scaling local to each frame and surface | |
| USER | Scaling by user-supplied values (-pl -ph) | |
| scale_model | LINEAR | Use linear scaling of contours |
| LOG | Use logarithmic scaling | |
| EXP | Use exponential scaling | |
| LAB7 | Use logarithmic in 7 levels scaling | |
| LAB13 | Use logarithmic in 13 levels scaling | |
| scale_mapping | SYMMETRIC | scale symmetrically around both side of zero |
| SEPARATE | scale separately for + and - data values | |
| TRUE_MAP | scale from most - to most + values | |
| color_map | RG | Use full red-to-green colour map |
| RG2 | Use red-and-green (2-colour) colour map | |
| FULL | Use blue-to-red (full) colour map | |
| BTW | Use black-to-white colour map | |
| WTB | Use white-to-black colour map | |
| lead_marking1 | LEADS | mark nodes with lead (channel) numbers |
| NODES | mark nodes with node numbers | |
| VALUES | mark leads with potential values | |
| CUBES | mark leads with spheres/cubes | |
| MINMAX_LABELS | mark extrema with lead numbers | |
| MINMAX_CUBES | mark extrema with cubes | |
| SCALAR | mark the selected scalar node | |
| num_cols | value | number of colours to use in shade display |
| num_conts | value | number of contour levels in display |
| draw_bbox | TRUE/FALSE | set bounding box on or off |
| datafile_path | pathame | alternate path to the .pak/.raw files in .data file. |
| geomfile_path | pathame | alternate path to the .geom files in .data file. |
| report_level | value | level of error reporting ( 0-3 ) |
Note that these parameters and values are not case sensitive and that they can all be overridden during execution of the program, typically via the mouse menu (right mouse button). See section 5.3 for details on the different scaling options. The list of parameters possible will also certainly grow with the program.
To save the current settings in a file, there is an option in the main menu of map3dgl which dumps all the settings to the file ./.map3drc, that is, the file .map3drc in the current directory. That way, when you start the program again from that directory, the same settings will be loaded. The .map3drc file is just a normal text file, but like all ``rc''-files, it is hidden from the ls command unless you add the -a option (the alias la is set up by default to do a long listing of all files, including hidden files). Dumping a copy of the settings is also the easiest way to see what settings are currently being maintained by map3dgl and also forms the best starting point to setting up your own customized default settings files.
The input of geometrical data may occur via a family of simple ASCII files used to describe geometry. These include the points or nodes of the geometry in a file with the extension .pts and the connectivities that described polygonal links between nodes, stored as line segments (.seg files), triangles (.fac files), and tetrahedra (.tetra files). A more recent consolidation of geometry information has resulted in a binary file format with the extension .geom. These files contain everything in their ASCII cousins, but also additional information, such as the channel information found in a .channels file (described in section 4.4 below). A .geom file can also hold this information for any number of surfaces, thus allowing the representation of a very complex geometry in a single file.
Rules for .pts files:
Rules for .fac files:
To facilitate the creation and management of .geom files, there are programs which convert between the two formats. The simplest of these is called gconvert and carries out conversions in either direction, either by leading the user through a dialog or via a control file containing the names of the files to be converted. With gconvert it is possible to construct any .geom file from sets of .pts/.seg/.tri/.tetra and .channel files. At present there is not documentation for gconvert, it was only written as temporary fix...three years ago. See Rob MacLeod (macleod@cvrti.utah.edu) for details.
In map3dgl the -f option determines directly in which files the geometry is to be found. Starting from the filename that follows -f, which may or may include a file extension, the program looks for all possible candidate geometry files and queries the user for resolution of any ambiguities. Thus if the program is called with the argument map3d -f myfile, map3dgl3d looks for myfile.geom, myfile.pts, myfile.tri, etc, and tries to resolve things so that a geometry description is found. This can be controlled to some extent by typing the geometry filename with an extension according to the following rules:
| Extension | Effect |
| none | look for .pts and .geom and if both are presents, ask user which to take |
| .pts | take only the .pts file and ignore any connectivity or .geom file |
| .fac | take .pts and .fac and ignore any .geom files present. |
| .geom | take the .geom file and ignore any others present. |
A further way to read geometry into map3dgl is to use the geometry filename contained within the .data file that contains the potentials. This requires that the .data file be created with the geometry filename listed; adding this after the fact is difficult. Even if a geometry filename is found in the .data file, it can be overridden by the geometry file name specified in the argument list of map3dgl.
The scalar data values that are assigned to the points in the geometry are input via .pot files, while vectors are input via .grad files. Scalars are ordered in the same way as the node points as a simple one-to-one assignment is performed, although a channels file can be used to provide indirection (see section 4.4) . Vector information is self-contained since it is expressed as start points and vector components in 3-D coordinates and may, therefore, be ordered in any way the user wishes.
The rules for .pot files are:
The rules for .grad files are:
A set of files that contains a time sequence of data should have filenames of the form base-filename001 to base-filename NNN, with the numeric suffix (NNN) being a three-digit value, which can run in any regular increments. For example, pot-file001.pot, pot-file005.pot, pot-file009.pot, pot-file013.pot, ...
The newly developed standard data files (.data files) are capable of holding not only the scalar and vector data found in the older .pot and .grad files, but also links into existing ``pak-tape'' files, the name of the suggested geometry files, and various other bits of information that could be useful to map3dgl.
There are some concepts of the data file structure that should be understood to appreciate the different modes of operation described in section 2.1.
map3d -f datafile.data@2
which selects run 2 from the .data file datafile.data.
map3d -w -f geomfile.geom@1 -p datafile.data@2 -s 10 130 -i 2
specifies that surface 1 from the geometry file geomfile.geom
should be used to display frames 10 to 130, taking every second
frame, from run 2 of the .data file datafile.data.
Leadlinks and channels files, and the arrays they contain, are identical in structure, but not in function. A program may require both, either, or neither of these, depending on the structure of the data files and geometries. The basic function of both leadlinks and channels information is to offer linkages between recording locations and the data that is to be associated with those locations. One , leadlinks, describes the connection between ``leads'', a measurement concept, with ``nodes'', and geometrical concept. The channels information, on the other hand, links the nodes to ``channels'' of data in a data file. Or, in more detail,
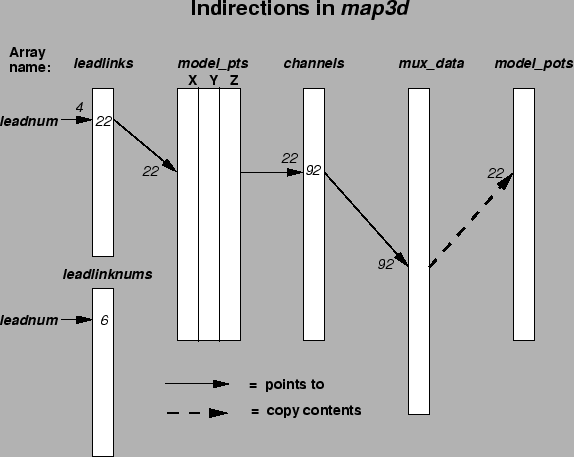
In the leadlinks array, each entry refers, by its location in the array, to a particular lead; the array value at that location gives the number of the node in the geometry file to be associated with this lead. For example if lead 4 has a leadlinks entry of 22, then node 22 in the geometry will be displayed with a ``4'', not ``22'', when lead markings are selected in map3dgl.
Hence we have the situation of a lead number K actually being called lead number L, pointing to node number M in the geometry. The map3dgl program now handles this additional indirection, and other programs are bound to follow suit as the need arises.
Note that channels arrays are used at the time the data is loaded into the internal data storage arrays! The most frequent use of channels information is to unpack multiplexed data. This data come from input files with an inherently different structure in terms of geometry nodes and need to be sorted so that their spatial arrangements are known. The channels array provides the information needed to perform the sorting. An example would be data collected from multiple needles. The data are stored in a block, with no preconception of what spatial relationship individual electrodes on those needles might have to one another. These relationships can only be fixed by the geometry information of where each electrode was located and what surfaces these locations are grouped into. To untangle this mess, a separate channels array is used for each surface, to point to the measured data values which belong to that surface, and to determine which data value is associated with each node location.
If data and geometry nodes match one-to-one, there is no need for a channels array. In programs like pscont, on the other hand, a channels array is almost always a necessity because of the mapping from a three- to a two-dimensional geometrical representation. There are single points in the three-dimensional version of the geometry that have two equivalent points in the two-dimensional version of the geometry used for map display. Hence, pscont stores those channel filenames internally and associates then to a particular choice of plot geometry. In map3dgl, there are many cases in which channels information is not needed.
The figure 1 shows an example of lead and channels information layered one on top of the other. See the figure caption for details.
|
The source of both channels, leadlinks, and leadlinknums information can be either the geometry (.geom) file or the data (.data) file, or two explicit files, called ``leadlinks'' and ``channels'' files, which are described in the next sections below.
Information for the channels array is stored as an associated scalar with the data information in the standard .geom files. At present, there is no leadlinks array stored in the .geom file but this could change at an time.
A leadlinks file is an ASCII file, the first record of which
contain a line nnn leads, where nnn is the number of leads to
be described in the file (and also one less than the total number of lines
in the file). Each following record contains two integer values:
    32 Leads
    1   1
    2   42
    4   31
    7   65
    .   .
    .   .
    .   .
    32  11     <---- 32nd entry in the file, at line 33 of the file.
indicates that there are 32 leads to be linked, and that lead 1
is called lead 1 and is node 1 in the geometry file. Lead two is at node
42, but lead 3 is called ``4'' and is found at node 31. Likewise, lead 4
is called 7, and is located at node 65, and so on, up to lead 32, called
32, at node 11.
Nodes listed in a leadlinks file passed to map3dgl with the -l option can be marked either with coloured cubes (spheres) or labeled with the numbers of the lead or the number of the corresponding node, depending on the setting of the ``Toggle node display'' menu item. When we mark all the nodes, by selecting ``Mark nodes with node numbers'' in the ``Toggle node display'' menu, all nodes are labeled, not just those which are leads.
Likewise, the nodes at which the maximum and minimum potential values are found to occur, and the location used for the scalar lead display (see section 5.2) can be marked.
A .channels file is an ASCII file, the first record of which contain a
line nnn nodes, where nnn is the number of nodes to be
described in the file (and also one less than the total number of lines in
the file). Each following record contains two integer values:
    352 Nodes
    1    123
    2    632
    .    .
    .    .
    32   12
indicates that there are 352 leads to be linked, and that the data value
for the first node is located at location 123 of the data file. For node
2, the data value is to be found at location 632, and so on.
With so many options for defining a node, and the lead or channel associated with it, there is room for ambiguity in the numbers that appear in a display next to the nodes. The conventions used in map3dgl are show in the following table:
| Node number display conventions | |||
| Lead Marking | Lead/channels file present | ||
| None | Channels | Leadlinks | |
| Node numbers | same as in geometry files, starting at one for each surface | unaffected | unaffected |
| Lead numbers2 | same as in geometry files, consecutive over all surfaces | channel numbers | leadnumber from leadlinks info |
| Data values | potential value | potential value | potential value |
These files contain what I refer to as ``landmarks'' on the surface(s) of the geometry, whose primary purpose is to provide visual references for orientation when viewing the map3dgl display. Initial use was primarily for coronary arteries, but the idea has been expanded to incorporate a number of different orientation landmarks. The original coronary artery class of landmarks requires only that each can be described as a series of connected points, with a radius defined for each point. The coronary landmark is then displayed as a faceted ``pipe'' linearly connecting the points at the centre, with a radius, also linearly interpolated between points, determining the size of the pipe. The landmark file can contain numerous, individual segments of such pipe-work, each of which is drawn separately.
Other classes of landmarks are described below, but all of them can be described in a file with the following general format:
| Line number | Contents | Comments |
| 1 | nsegs | number of landmark segments in the file |
| 2 | 1 type nsegpts seglabel | segment number (1), type, number of points, label_number |
| 3 | X, Y, Z, radius | point location and radius of point 1 |
| 4 | X, Y, Z, radius | point location and radius of point 2 |
| . | . | . |
| . | . | . |
| nsegpts + 2 | X, Y, Z, radius | point location and radius of last point in segment 1 |
| . | 2 type nsegpts seglabel | segment number (2), segment type, number of points, and label |
| . | X, Y, Z, radius | point location and radius of point 1 |
| . | X, Y, Z, radius | point location and radius of point 2 |
| . | . | . |
| . | . | . |
| . | X, Y, Z, radius | point location and radius of last point in segment 2 |
| . | . | . |
| . | . | . |
| . | . | . |
| . | . | . |
The landmark types defined to date are the following:
| Name | Graph. object | Description |
| Artery | faceted pipe | a coronary artery/vein segment |
| Occlusion | coloured sphere | an experimental occlusion that could be open and closed |
| Closure | coloured sphere | a permanent occlusion that cannot be opened |
| Stimulus | coloured sphere | a stimulus site |
| Lead | coloured sphere | a particular electrode or lead location |
| Plane | rectangular parallolopiped | a cutting plane through the geometry |
| Rod | lines | rod inserted into needle track to digitize needle electrode locations. |
| PaceNeedle | sphere | location of a pacing needle entry point |
| Cath | facetted pipe | location of catheter in a vessel |
| Fiber | arrow | local fiber direction indicator |
| RecNeedle | sphere | location of recording needle entry point |
| Cannula | tube? | coronary vessel cannulus |
Specifying snare, closure, and stimulus requires a single point in the landmarks files, and the resulting sphere is coloured according to a set of values defined in the drawsurflmarks.c routine. At present, the values used are:
| Occlusion | cyan |
| Closure | blue |
| Stimulus | yellow |
and they are not (yet) adjustable by the user, except by using the ``regular'' trick of playing interactively with the colour map with the cedit program.
To specify a plane landmark requires three ``points''
| Point | X,Y,Z | Radius |
| 1 | First point of plane | Radius of the plane |
| 2 | Second point of plane | Thickness of the plane |
| 3 | Third point of plane | not used |
The idea of map3dgl has always been to display multiple sets of data on multiple surfaces; the limitation has been how much flexibility to included into a single invocation of the program. At present, map3dgl will handle either multiple surfaces in a single window, or multiple windows with a single surface in each, but not multiple windows with more than one surface in each.
Since this level of control is provided for each surface, it is possible to have points showing on one surface, mesh on another, and rendered potential shading on a third, and so on.
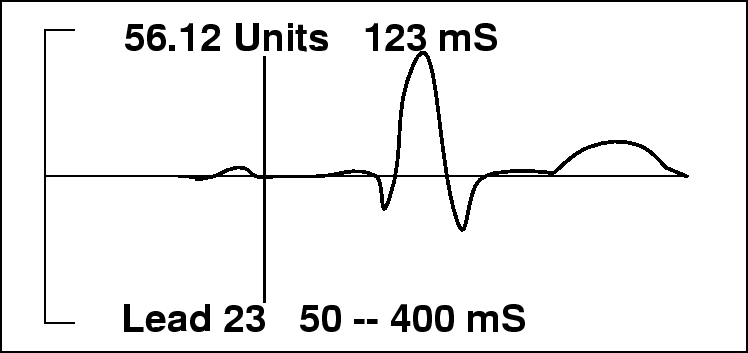
When the -t trace-lead-num option is used, data from the incoming frames of map data are collected as a time sequence and used to construct a scalar plot of a the lead selected by the value of trace-lead-num. The value of trace-lead-num is interpreted in different ways depending on whether leadlinks information (see section 4.4) is present: if there is leadlinks information, then the lead number is passed through this indirection before being connected to a node in the geometry/data. If there is no leadlink information, then lead number = node number.
Figure 2 shows the layout and labeling of the scalar window. Font sizes adjust with the window size and the type of units may be explicit if the .data files contain this information.
 |
An easier way to control the display of a scalar lead information is to let the program start without a lead selection and then choose a lead interactively. To do this,
Note: there is an option in the pick menu that toggles between each new scalar making its own window, and each new scalar replacing an existing one--i.e., there are two modes now, one in which each surface has one scalar and another in which there can be as many scalars as desired.
The format of the scalar display is fairly simple and self-evident, with a red vertical bar moving along the time axis as the frame number is advanced. The time axis is derived from the frame numbers of the files, not simply the number of files which are read in, i.e., if frames (or pot file number) 10-20 are read in with an increment of 2, then time will begin at 10, and go through 12, 14, 16, 18 and end at 20, and will not begin at 0 or 1 and go to 5 (the number of frames of data actually read). This is also reflected in the display since the time axis always begins at 0.0; data from later in time appears shifted to the right, to a degree determined by the starting frame number.
In order to facilitate rapid movement through large datasets, the user can control the frame number being displayed by interacting with the scalar window itself. If the user moves the cursor to the scalar window and pushes the left mouse button, the vertical time bar will jump to the nearest sample to the cursor location. The user can then hold the left button down and slide the time marker left and right and set a desired frame. Once the mouse button is released, the map display is updated. Movement on a frame by frame basis, via the left and right arrow keys, works as it always has. The only other command allowed when the cursor is within the scalar window is the ``q''-key , to shut down just the scalar window. Any other attempt at input will cause the bell to ring and an error message to be printed.
Scaling is performed in a number of different ways in map3dgl, and is applied to potential and current data, both in the contour lines constructed from potential distributions, and in the colours used to display shaded and contoured potential data and current vectors. The type of scaling depends on the following parameters set by the user interactively via the mouse menus (right mouse button) or from the .map3drc file at startup:
Related to scaling--and controlled from the same menus--is the reference potential used for the displayed data. By default, the potential (or any other scalar) values are assume to already have the right reference and nothing is done to change that. The user can, however, select a new reference, and then subtract that reference from all signals in the surface. There are at present two types of references the map3dgl supports:
When selected from the Scale Scope or Scale Mapping menus, subtracting the means results in the average value for each instant in time over each of the surfaces being subtracted from the scalar data. This is equivalent to taking the (square root of the) power curve and using that as the reference potential. The control for this feature is a toggle that is managed from either the Scale Scope or the Scale Mapping main menus.
It is also possible to select a single channel of data and use that as the reference signal. Control of this happens in two stages, first the user must select a channel to use as the reference; the pick mode called ``Pick reference lead'' performs this operation. The second component is to apply that reference to the rest of the signals. Control for this is in the Scale Scope or the Scale Mapping main menu. Selecting a new reference lead works properly, i.e., the effect is not cumulative but first restores the data to the original state, than applies the new reference.
The use of clipping planes is one feature of map3dgl which is undergoing constant development. At the moment, we have the capability of setting a single cutting plane at a point perpendicular to any of the six major axis of the 3D space. Once set, a clipping plane may be interactively shifted along the axis so that different regions of the data can be visualized. A second method of clipping the data is to translate the entire dataset so that it impinges upon one of the sides of the cubic bounding space (frustum). By moving the data, eg., forward until it meets, and is clipped by, the front plane of the frustum, then sliding a clipping plane along the same axis from the back towards the front, a slab of data space can be isolated for viewing. Both of these operations require use of the dial box (see section 6).
A further degree of freedom with the clipping planes is whether the plane moves with the data during rotation and translation of the geometry, or whether the clipping planes stays fixed (with regard to the screen) while the data rotates and shifts through it. The Clipping Planes menu offers the user a choice between locked mode, in which the clipping planes rotates with the geometry, and unlocked mode, in which data moves through the fixed plane, i.e., clipping plane and geometry are unlocked.
In map3dgl the default view mode is orthogonal and there is no depth cueing. Both can, however, be switched on at the user's request. To toggle between orthogonal and perspective views, use the o-key. Currently, the modeling transformations (rotation, translation, scaling) are all reset when you switch modes, but this will hopefully be handled better in the future. Note that in perspective mode, scaling and translation can be used to change the degree of perspective in the display. By moving the object further away (with the translate dial) and then increasing the scaling, the degree of perspective is reduced, while by pulling the object closer and reducing the scaling, the opposite occurs. The use of the bounding cube (see next section) can serve as additional visual feedback on the spatial definition of the object in the display.
Depth cueing works by reducing the intensity of lines and points in the display as a function of the distance from the viewer (eye location). The distance from objects in the display to the viewer is stored in a separate ``z-buffer'', which has a value for each pixel in the screen. Depth cueing is useful when viewing geometries or objects which would otherwise be drawn with constant colour, but is misleading and invalid when the colour is already being used to convey other information (e.g., colour-coded contour lines). Hence, use depth-cueing at your own discretion. At the moment (February 21, 2002), depth cueing is only supported for drawing points and lines in map3dgl. It can be combined with perspective view to get fairly realistic images of three-dimensional objects which are drawn as a wire mesh or as points.
To control depth cueing, use the d-key to toggle, and two menu items in the ``Set Clipping Plane'' menu to tune. The menu items ``Z-buffer near'' and ``Z-buffer far'' allow the lower right (clipping plane) dial to be used to move the front and back (near and far) z-buffer planes either closer to (counterclockwise dial rotation) or farther from (clockwise rotation) the viewer. The trick to using this feature effectively is to note that when the near z-buffer plane moves through an object, ever pixel that is in front of it is drawn at full intensity (no depth cueing). The far z-buffer plane has the opposite effect in that as it moves forward through an object, pixels located behind it are drawn at minimal (often black or background) intensity. The region between the two z-buffer planes is spanned by the range of colour intensities which are set in the program (currently 20 linear steps span the full range of each colour). Note that this is not the same effect as moving the clipping planes around since the change in intensity is gradual, and the result depends on which z-buffer plane is used. If the two z-buffer planes meet, the object becomes invisible (for obvious reasons), a situation which map3dgl permits, but hardly encourages.
If desired, a three-dimensional bounding box can be drawn around the object(s) in the display. This box can be useful when viewing in perspective mode, and may even add a decorative touch to some images. To remove it, use the ``Bounding Box'' option on the menu pull-down menu. Any suggestions for enhancement of this sort of thing are welcome!
Control of map3dgl is by the keyboard, mouse, and dials. Many option are available via the menus initiated with the right mouse button, while others can be activated or toggled with single keystrokes. Variable (non-binary) adjustments usually occur with the dials, if they are present, or by repeating keystrokes. Below are tables of all the current control devices and their function. When the program launches, the user sets one or more windows which can be resized and moved at any time. When launching the program with the -b option, the resulting borderless window(s) can still be moved using the alt-key together with the right mouse button.
In order to control the amount of printed feedback map3dgl provides (which is posted in the window from which the program was launched), the user can select a value between 0 and 3 from the a sub-menu of the main menu titled Report level. The settings and level of output are as follows:
| Report Level | Types of output |
| 0 | minimal output -- just changes in status |
| 1 | report extrema |
| 2 | report some warning messages |
| 3 | debug mode |
Each key of the regular keyboard, the function keys, and the keypad are mapped to some function of the map3dgl. Most keyboard keys serve as toggles to change between a mode being on or off, i.e., ``m'' toggles the display of the geometry mesh. A list of the keyboard keys and their functions is shown in table 1; table 3 describes the action for each of the function and arrow keys, and table 4 the actions of the keypad keys.
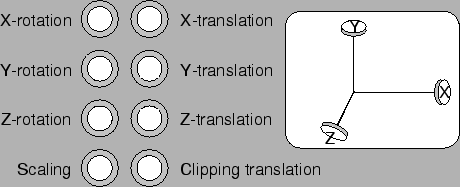
Perhaps the most intuitive control of map3dgl occurs via the dial box. This device allows ``analog'' control over any GL application that makes use of dial input by allowing the user infinite control over any control parameter linked to the dials. In map3dgl, the primary continuous interaction with the program is in placing the object in the display, choosing the viewing angle and the scale factor, and adjusting the clipping planes. Hence these functions are mapped to the dials, as described in table 2 and figure 3 below.
Note that all rotations via the dial box are relative to the screen coordinate system. This system has the x-y plane aligned with the screen, the x-axis pointing from left to right, the y-axis from bottom to top, and the z-axis pointing away from the viewer, perpendicular to the screen. One can picture the rotation dials as being attached to the positive ends of the three axis. See figure 3 for a description of this.
| ||||||||||||||||||||||||||||||||||||
 |
Providing the computer has a keypad that GL recognizes, map3dgl now also supports a keypad interface to the rotation and translations that was previously only available through the dials, and to a limited extent the mouse. See the table 4 below for details of the mapping.
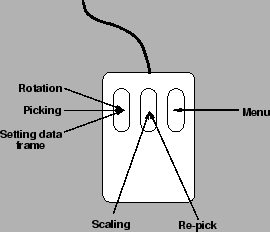
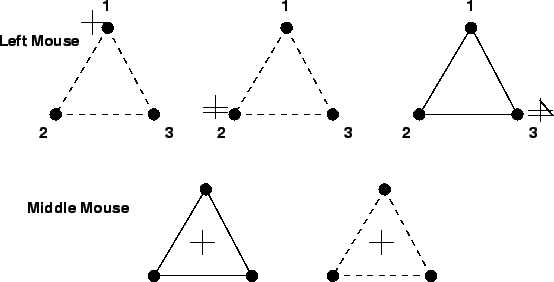
The mouse can be used for different purposes depending on the current mode. This is especially important when picking is selected. Note that the middle mouse button selects the most recently selected picking action, unless the ``Turn off picking mode'' option is selected in the ``Toggle Picking'' submenu. Figure 4 shows the various actions of the mouse buttons.
 |
| ||||||||||||||||||||||||||||||||||||
| ||||||||||||||||||||||||||||||||||||||||
When more than one surface window are used, certain manipulations apply to the window which currently has focus (the one in which the mouse cursor sits), while others may apply to all windows synchronously. Rotation and translation can apply to one or all windows (select which via the menu or F11 key), while scaling modes, colour maps, and frame numbers are applied to all windows concomitantly.
With the time signal (scalar) window, it is possible to move the frame counter with the mouse by clicking at a new location along the time axis or by clicking and dragging the vertical frame marker bar. Normally, this will control all surfaces at once, i.e., the frame counters are locked. It is sometimes useful, however, to unlock the frame marker and to this end, we have the main menu item ``Frame Control''. Likewise, it is often nice for the display to adjust the time value on the time series window to a new zero. This makes it easy to measure time durations from any point in the time signal. Finally, map3dgl assumes a default sampling rate of 1000 samples/s in the display; to change this, we have a submenu.
The options of the Frame Control menu are as follows:
The most frequent use of the frame locking control is to time align data from mutliple time series. The steps for this are:
To add this information to a map3dgl shell script, do the following:
By ``picking'' we mean selecting some piece of the display in the current window using the mouse (with buttons). In map3dgl there are a number of different pieces that can be picked, nodes, triangles, scalar leads, etc., all of which either return some information, or affect the display, or even the geometry of the display. To select what is to be picked, use the main menu and choose ``Pick Mode'' and then one of the choices in the ``Toggle Pick Action'' submenu. Below we describe each of the picking option in more detail.
Note that after picking, the program remembers what the last pick mode was and allows you to instantly go back to that pick mode by clicking the middle mouse button. To have the ``normal'' function of the middle mouse button restored, select ``Turn picking off'' from the ``Toggle Pick Action'' submenu.
To adjust the size of the picking window, the keypad plus/minus keys can be used, much as they are to alter the sensitivity of the dials to rotation and translation. Experience suggests that a larger window makes triangulating (selecting nodes) easier while a small window makes selecting triangles (to remove or flip them). Each picking mode maintains its own picking window size so that changes affect only the current picking mode.
This mode simple returns the location, in the same coordinates in which the point data was originally read into the program (the points are shifted to keep the object at the center of the screen's coordinate system).
When simple triangle picking is selected, the node numbers of each of the vertices of the triangle are displayed, along with the coordinates of the nodes at those vertices.
You can edit the triangulation of the mesh by selecting the ``Triangulate'' option from the ``Toggle Pick Mode'' submenu. In this mode, the left mouse is used to select the nodes that you wish connected into a triangle. Note that the cursor changes each time you select a valid point (see figure 5). If there is no change,then you either hit no points, or two points. Adjust the display, or the sensitivity of the picking window (keypad plus/minus keys) and try again. The window from which map3dgl was launched will tell you more, and on the Indigo(s), sound effects provide audio feedback.
 |
Pushing the middle mouse button selects the nearest triangle and kills it, removing it from the list.
Files with the latest version of the connectivity are updated each time you leave triangulate mode, which you can do by either hitting the ``Q'' key or selecting ``Turn picking off'' option. The filenames are created in a random fashion and are (optional) removed when you end the session and save the latest version of the geometry in a file of you choice. When you go to exit map3dgl, you will be asked for the basefilename into which you wish the updated version of all surfaces (points and connectivities) to be stored. At the moment, these files are .pts/.fac files, which can easily be converted to .geom files if needed.
Often it is necessary to know the orientation of the triangles in the geometry. While this can be computed, there remains a 180-degree ambiguity as to which way the normal points. To resolve this, triangles nodes should be ordered in a counterclockwise direction as viewed from the ``outside'' of the surface to which the triangle belongs. This convention is used by GL to decide which triangles to show in ``hide backfacing triangles'' mode (which you can toggle with the E-key in map3dgl). Unfortunately, it is not always possible when constructing geometric models to tell which way the triangle is to be viewed -- this is still something humans do better than computers -- and so we often need to edit a geometric model so that the triangles are 'flipped' the right way. Hence, the ``Flip triangle'' option in the ``Toggle Pick Action'' submenu.
To check a model for correct triangle orientation and flip the offending triangles, select ``Flip triangle'' from the ``Toggle Pick Action'' submenu. The cursor will change shape (to a cross-hairs with triangle around it) and map3dgl will go into ``hide backfacing triangles'' mode. This means that only the front-facing triangles are drawn and the holes indicate which triangles need flipping. Then the cursor in each triangle you want to flip and hit the left mouse button. If you were successful, the triangle will fill in.
This option, like triangulating, produces a new connectivity file, which is saved temporarily in a random filename each time you leave triangle-flip mode. When the program finishes, you will be prompted for the base filename of a new set of points and fac files, thus preserving the original files for later use.
map3dgl provides a number of tools for editing the geometry at the heart of the display and also saving those changes in new versions of the geometry files. An example of this is described in the previous section 7.3 for altering the node connectivity. Other examples include the ability to apply the current viewing transformation to the geometry and save the result, typically for use in another graphics program (see section 8.1).
While screen images are lovely to look at, we need to be able to get the output from the screen to some transportable medium like paper, video tape, or film. This section describes some of the methods available for this process.
With the addition of the psgl software (after significant modification), we are able to generate postscript files from map3d. There are still some restrictions and bugs in the system, but the essentials work and I encourage its use. To create a postscript file, run map3dgl and set up the view you want. Then push Control-Shift-PrntScreen, all at the same time. You will see some activity in the window you started map3dgl from, and the name of the output file will be listed somewhere in the output.
You can view the resulting postscript file with xpsview or gv and print it directly using the printit command. The psgl software produces proper postscript files, not images dumped to postscript so the output quality is excellent.
At the moment, the system defaults to producing true colour postscript but the option exists to convert the image to black lines (or gray shades) on a white page. To select this, go to the Shading/Contours menu or the Colour Maps menu and select Toggle Postscript background. Dashed lines are also printed by psgl, if you have previously selected the ``Dashed lines for negative values'' option in the Colour Map menu.
Problems and known bugs include the fact that numbers that a clipped out of the view, appear to the right had side of the image, overwriting themselves and some potentially useful stuff on the page. This is a bug on the underlying SGI software and I am still not clear what the best fix will be. At present, the only option is to edit the postscript directly. Another weakness is that postscript does not perform Gouraud shading and so coloured surface facets come out in a constant colour. This too, we are working on.
There are no standard provisions in GL for generating output from the images generated by map3dgl. However, using an SGI utility (the same one used in the program snapshot) it is, in fact, possible to capture the contents of any area of the screen and save it as a file. Once preserved, this file can be viewed later, either by itself or as part of a sequence of images, with an animation program called movie. The contents of the file can also be converted either into other image formats for transport to other computers or conversion to Postscript for generation of hard copy.
To capture an image using map3dgl simply set the image you want to preserve and hit the ``w''-key. There will be a pause of between 5-30 s and then the workstation should beep and a line will appear in the control window telling you where the image has been stored. Filenames for image storage are generated automatically, using either the name of the geometry files (if no data is present), the name of the current potential (or gradient) file if data has been read into the program, or the filename specified with the -if option. Appended to this base filename are sets of four digits, denoting the frame number currently in the display, starting with ``0001''. Thus, for example, if the geometry files `daltorso.pts and daltorso.fac are being displayed, with data from the file daltorso-pot004.pot (which was read as the fourth frame of potential data), the first file produced would be daltorso004-0000.rgb. Note the .rgb file extension, standard for this sort of file, which is also referred to as an ``r-g-b'' file. If, on the other hand, the user started map3dgl with the string -if movierun, then the images files will be named movierun-0001.rgb, movierun-0002.rgb, etc,.
The screen area captured in this mode is the smallest rectangle that contains all the windows currently managed by the current invocation of map3dgl. This often requires with careful placement of the windows or setting the background window for the display to black or something that matches the background of the map3dgl display.
To view a file, or a set of files again on the screen, use the movie program, or the moviemaker. Simply call the program and append to it the name(s) of the files you want to view. To view a set of image files with a common root, e.g., daltorso000-001.rgb to daltorso000-010.rgb, use the calling sequence movie daltorso000-*.rgb. The result is an animated sequence, which can be stepped through, looped, or 'swung' back and forth. Once the images are loaded, control of movie is with the right-hand mouse button, pull-down menu. (See the man page on movie)
A frequent task when capturing images from the screen of a map3dgl session is the conversion of image formats from the native ``RGB'' mode of the SGI to something more portable. While the manual already describes the necessary steps in performing such conversions (see section 9), there is now a utility (a shell script, written by Rob MacLeod (macleod@cvrti.utah.edu)3) available to perform a variety of conversions in a flexible manner. The utility is called ``rgbto'' and it has the following usage:
  Usage: rgbto [-i -c -b -a] infilename
   -i to invert image colors (default is to leave alone)
   -c to leave in colour (default is black/white)
   -b to use black and white (default is gray shades)
   -a to product (Apple) pict file output (default is postscript)
The input is assumed to be one or more rgb files, and the output is either
in postscript or pict format. The controls allow for the conversion from
colour to grey shades or black and white (by a simple thresholding), as
well as an inversion of the colours. It will accept more than one filename
as input so that invocations such as, for example,
rgbto -ca *.rgbare possible.
With the frame buffer card in the SGI, and the video local area network (V-LAN) hardware, we can generate animation sequences on video tape from map3dgl. Control of the sequence, which may be a geometrical movement of objects in the display, or a series of sets of data on a stationary geometry (or both concurrently), is by the program animator described elsewhere. In effect, animator submits commands to the event loop of map3dgl and then captures the images from the GL window, moves them to the frame buffer, and then to video tape.
The most obvious feature of video recording in map3dgl is that the user can (actually must) select a window somewhere on the screen that defines what portion of the display is actually captured for video. If the -v option is used to launch the program, the user will see a red, rectangular box, together with a smaller, white text window with instructions. When the left mouse button is held down, moving the mouse now moves the rectangular video box; when the middle mouse button is pushed the location of the video box is fixed. The region within the innermost rectangle fairly accurately represents what will make it to the video screen. To relocate the video outline, return to the white text window and click the left mount button.
With the separation of animation from video output and the desire to have thicker lines for photos without the video colour scheme, map3dgl now offers independent control of the various aspects of what was formerly video control. There is now a menu for video control, which includes options to turn the video window on (similar to the H-key), to toggle video colours (similar to the V-key) and to set the line width that is used.
There are now too different ways to convert images from map3dgl (or any other output on the screen of the SGI terminal) into photographs or slides. The first, and most direct, is to set the camera up in front of the screen and blast away. The second involves grabbing images from the screen, converting them to a form understood by a Macintosh and then reading (and editing) them with an appropriate Mac program.
This process is simple and actually works very well (well enough to make the cover of journals) if you proceed as follows:
Some tips that I have found useful for making photos are as follows:
xsetroot -solid black
The method here is very similar to the image capture and conversion described in sections 9.2 and 9.3, except that instead of converting the image to Postscript, we convert it to a form that the Macintosh can read. The form we have used with best success so far is the ``pict'' file, a native Apple format that can be read and written by most Macintosh applications. To convert the .rgb file filename.rgb produced by snapshot into the pict file filename.pict, use the rgbto command with the -a option, e.g.,
rgbto -a filename.rgb
Now the file is in a form which is directly readable by the Macintosh. The file still resides on the SGI but can either be copied to the Mac using ftp (accessible from either NCSA Telnet or Versaterm), or the Macintosh program fetch.
For more information on the hard- and software in the Graphics Lab, talk to Phil or see the documentation he is preparing on these facilities.
Using script files to control map3d has numerous advantages, for example:
A script files are simple programs written in the language of the Unix shell. There are actually several languages, one for each type of shell, and the user is free to select. At the CVRTI we have decided to use the Bourne shell for script programming (and the Korn shell for interactive use) and so all scripts will assume the associate language conventions. The shell script language is much simpler to use and learn than a complete, general purpose language such as C or Fortran, but is very well suited to executing Unix commands; in fact, the script files consist mostly of lists of commands as you might enter them at the Unix prompt. Even more simply, a script file can consist of nothing more than the list of commands you would need to type to execute the same task from the system prompt.
Script files are simple text files and so are usually created with an editor such as emacs. You can, however, also generate a script file from a program, or even another script. But all script files can be read and edited by emacs and this is the way most are composed.
To learn about the full range of possibilities in script files requires some study of a book such as ``Unix Shell Programming'' by Kochan and Wood but the skills needed to make map3dgl script files are much more modest; any book on Unix will contain enough information for this. The instructions and examples below may be enough for many users.
Here are some rules and tips that apply to script files:
         map3d -f geomfilename.fac \
               -p potfilename.data \
              -cl channelsfilename
Make sure that there are no characters (even blank spaces) after the continuation character!!! This has to be the most frequent error when the script file fails to run or stops abruptly.
chmod 755 script_filename
         varname=2
         varname="some text"
         varname=a_name
Do not leave any spaces around the ``='' sign or the command will fail and set the variable to an empty string.
Once defined, the variables can be used elsewhere in the script as follows:
         geomdir=/u/macleod/torso/geom
         geomfile=datorso.fac
         datafile=dipole.data
         map3d -f ${geomdir}/${geomfile} -p $datafile
The curly braces are required when the variable name is concatenated with other text of variable names but is optional otherwise. To concatneate text and variables you simply write them together (e.g., geomdir/geomfile.pts comcatenates the two variables with a ``/'' and the extension ``.pts''.
All the environment variables are available and can be set in the script. For example:
mydir=${HOME}
sets the variable $mydir equal to the user's home directory.
Likewise,
         MAP3D_DATAPATH=/vax/odisk0/bt2feb93/
         export MAP3D_DATAPATH
defines and ``exports'' the environment variable used by map3d to find
.pak files.
Below are some sample scripts, from simple, to fairly complex:
         map3d -f ${HOME}/torso/geom/dal/daltorso.fac \
               -as 100 500 300 700 \
               -p ${HOME}/maprodxn/andy3/10feb95/data/cooling.data \
               -s 1 1000
#!/bin/sh
# A script for the spmag 1996 article
#
######################################################################
map3d=/usr/local/bin/map3d
map3d=${ROBHOME}/gl/map3d/map3d.sh
MAP3D_DATAPATH=/vax/odisk0/bt26mar91pack/
export MAP3D_DATAPATH
echo "MAP3D_DATAPATH = $MAP3D_DATAPATH"
basedir=/u/macleod/maprodxn/plaque/26mar91
$map3d -b -nw \
	-f $basedir/geom/525sock.geom \
	-as 150 475 611 935 \
	-at 150 475 485 610 -t 237 \
	-p $basedir/data/pace-center.data@1 \
	-s 65 380 \
	-f $basedir/geom/525sock.geom \
	-as 476 800 611 935 \
	-at 476 800 485 610 -t 237 \
	-p $basedir/data/pace-center.data@1 \
	-s 65 380 \
	-f $basedir/geom/525sock.geom \
	-as 150 475 176 500 \
	-at 150 475 50 175 -t 237 \
	-p $basedir/data/pace-center.data@1 \
	-s 65 380 \
	-f $basedir/geom/525sock.geom \
	-as  476 800 176 500 \
	-at  476 800 50 175 -t 237 \
	-p $basedir/data/pace-center.data@1 \
	-s 65 380
If you can figure this one out, you are a shell script guru! Running it is child's play and it displays epicardial and tank surface potentials for two different runs from any Andy2 tank experiment. The beats are time aligned based on the values in a separate parameter file that must exist for the particular experiment.
#!/bin/sh
# Filename: map3d-comp2.sh
# Display epicardial and torso potentials from two runs of the same file
# using a standard layout and a file or parameters to feed the script
# with all it needs to know.
# The minimum argument of this script is the name of the parameter script
# as without it, we have no idea what to do.
# The parameters are stored in a file, that when executed, sets them
# Format is therefore very flexible.
#
# Assumptions:
#    That geometry is in ${date}_sock.pts and .fac
#    That landmarks are in ${data}_cor.lmarks
#    That we have 64 lead socks with the standard channels (193--256)
#    That the 192 lead torso geometry is used.
#
#
# Last update: Sun Jun  2 18:12:42 1996
#    - fixed a few things in the run number entry
# Last update: Wed Dec 13 12:28:46 1995
#    - still trying to expand and generalize
# Last update: Tue Oct 24 10:22:10 1995
#    - created
######################################################################
#### Set up parameters ####

MAP3D=${HOME}/gl/cj/map3d
MAP3D=/usr/local/bin/map3d
MAPRODXN=${HOME}/maprodxn
USAGE="\nYou can run this script with arguments as follows:\n\
     $0 paramfile.m3dp [-ocsd0145etc] n1 n2, where\n\n\
     paramfile.m3dp is a script that sets the local parameters\n\
     -o = optical disk\n\
         0=odisk0; 1-odisk1; 4-odisk4; 5-odisk5\n\
     -b = backup disk\n\
     -s = scratch disk\n\
     -d = data disk\n\
     -e = show epi only \n\
     -t = show torso only \n\
     -c = show coronaries\n\n\
     -v = show V1-V6 on tank\n\n\
     -i = show integral maps\n\
     n1 and n2 are the first and second run numbers\n\n\
     Make sure to GROUP ALL ARGUMENTS into one block!!! \n\n\
        e.g.,  $0 -co1 2 5\n\
     to get data from odisk1 and use runs 2 and 5 and show coronaries\n"

##### Check arguments #####
if [ $# -lt 1 ]
  then
  echo "\n *** Error in entry "
  echo " *** We need at least the name of the .m3dp (parameter) file ***"
  echo "$USAGE"
  exit
else
  paramfile=$1
  shift
fi

##### Execute script to set local params #####
. $paramfile

##### Check other input #####
run1=""
run2=""
#echo "Arguments are  $*"
doshift=0
showcor=""
showvleads=""
epionly=""
torsoonly=""
showint=""

if [ $# -gt 0 ]
  then
  odisknum=""
  dataloc=""
  while getopts bceiostvd0145 optval
    do
    case $optval in
      o | d | s | b) dataloc=$optval
                 doshift=1;;
      c)         showcor=1
                 doshift=1;;
      e)         epionly=1
                 doshift=1;;
      i)         showint=1
                 doshift=1;;
      v)         showvleads=1
                 doshift=1;;
      t)         torsoonly=1
                 doshift=1;;
      0 | 1 | 4 | 5)  odisknum=$optval
		 doshift=1;;
      \?)        echo $USAGE
                exit 2;;
    esac
  done
#  echo "Arguments after getopts are $*"
  if [ $doshift ]
    then
    shift
#    echo "Do the shift"
  fi
  # Read in the run numbers for first and second runs
  if [ -n "$1" ]
    then
    run1=$1
    shift
  fi
  if [ -n "$1" ]
    then
    run2=$1
    shift
  fi

#  echo "Arguments are $*"
#  echo "dataloc = $dataloc"
#  echo "odisknum = $odisknum"
  if [ "$dataloc" = o ]
    then
#    echo "Check odisk value = $odisknum"
    if [ "$odisknum" != 0 -a "$odisknum" != 1 -a "$odisknum" != 4\
      -a "$odisknum" != 5 ]
      then
      echo "+++ Odisk number was $odisknum so we set it to 0"
      odisknum=0
    fi
  fi
else
  echo "$USAGE"
  echo "\n We need some more input information"
  echo "\n If we need to know where to look for Vax data files"
  echo " where should we go?"
  echo " Enter the location of the Vax data files"
  echo " Optical disk drive 0 ................. 0"
  echo " Optical disk drive 1 ................. 1"
  echo " Optical disk drive 4 ................. 4"
  echo " Optical disk drive 5 ................. 5"
  echo " Datadisk ............................. d"
  echo " Scratchdisk .......................... s"
  echo " Backupdisk ........................... b"
  echo " $MAP3D_DATAPATH ............... return"
  echo "   Your entry? \c"
  read inchar
  case "$inchar"
    in
    0) dataloc=o
    odisknum=0;;
    1) dataloc=o
    odisknum=1;;
    d) dataloc=d;;
    s) dataloc=s;;
    b) dataloc=b;;
  esac
fi

###### Check fore silly combos #####

if [ "$epionly" -a "$torsoonly" ]
  then
  echo "*** Entry error: You cannot use -e and -t or there is nothing to see"
  exit 1
fi

###### Get the run numbers manually #####

needruns=""

if [ -z "$run1" -o -z "$run2" ]
  then
  needruns="t"
elif [ "$numruns" -gt 0 ]
  then
  if [ "$run1" -gt "$numruns" -o "$run2" -gt "$numruns" ]
    then
    needrun="t"
  fi
fi
if [ -n "$needruns" ]
  then
  echo " Now enter the first and second run numbers"
  echo " ? \c"
  read run1 run2
fi
if [ "$run1" -le 0 ]
  then
  run1=1
fi
if [ "$run2" -le 0 -o "$run2" -le "$run1" ]
  then
  run2=`expr $run1 + 1`
fi
if [ -n "$numruns" -a "$run2" -gt "$numruns" ]
  then
  run2="$numruns"
fi
#echo "run1 = $run1 and run2 = $run2"

###### Now see about the optical disk drive and set up some variables. #####

if [ $dataloc = o ]
  then
  echo " Make sure the optical disk called RMSPACK-1A is in drive $odisknum"
  MAP3D_DATAPATH=/vax/odisk${odisknum}/${thename}${thedate}pack/
elif [ $dataloc = s ]
  then
  MAP3D_DATAPATH=/vax/scratch/${datadir}/${thename}${thedate}/
elif [ $dataloc = b ]
  then
  MAP3D_DATAPATH=/vax/backup/${datadir}/${thename}${thedate}/
elif [ $dataloc = d ]
  then
  MAP3D_DATAPATH=/vax/data/mapping/
fi
export MAP3D_DATAPATH
echo "\n MAP3D_DATAPATH exported as $MAP3D_DATAPATH\n"

if [ ! -n "$ROBHOME" ]
then
   ROBHOME=/u/macleod
   export ROBHOME
fi

###### DO we have cor file? #####

if [ "$showcor" -a -z "$torsoonly" ]
  then
  corfile="       -lm ${MAPRODXN}/andy3/${thedate}/geom/${thedate}_sock.lmarks"
else
  corfile=""
fi

###### DO we have vleads leadlinks file? #####

if [ "$showvleads" -a -z "$epionly" ]
  then
  vleadsfile="       -ll ${ROBHOME}/torso/geom/andy3/leadset1_v1-6.leadlinks"
else
  vleadsfile=""
fi

###### Set up the parameters fore running the program #####

# PArse datafilename four .data extension, and strip it
if echo $datafile | grep .data > /dev/null
  then
  datafile=`echo $datafile | sed 's/.data//'`
  echo "Value of datafile updated to $datafile\n"
fi

if [ -n "$showint" ]
  then
  datafile=${datafile}_int
  echo "Value of datafile updated to $datafile\n"
fi

cd ${MAPRODXN}/andy3/${thedate}
#if [ -z "$numruns" ]
#  then
#  numruns=7
#fi
#runnum=1
# while [ $runnum  -le $numruns ]
#   do
#   if [ $run1 = $runnum ]
#     then
#     echo "Match fore run1 = $run1"
#     start1=${onset}${runnum}
#     echo "Start1 = $start1"
#     end1=`expr $start1 + $duration`
#   fi
#   if [ $run2 = $runnum ]
#     then
#     start2=${onset}${runnum}
#     end2=`expr $start2 + $duration`
#   fi
#   runnum=`expr $runnum + 1`
# done

########### Set up the start and end of the frames numbers
# This is no elegant, and must be expanded when numframes climbs
# but is appears to work

case "$run1"
  in
  1) start1=$onset1;;
  2) start1=$onset2;;
  3) start1=$onset3;;
  4) start1=$onset4;;
  5) start1=$onset5;;
  6) start1=$onset6;;
  7) start1=$onset7;;
  8) start1=$onset8;;
  9) start1=$onset9;;
 10) start1=$onset10;;
 11) start1=$onset11;;
 12) start1=$onset12;;
 13) start1=$onset13;;
 14) start1=$onset14;;
 15) start1=$onset15;;
 16) start1=$onset16;;
esac
end1=`expr $start1 + $duration`
case "$run2"
  in
  1) start2=$onset1;;
  2) start2=$onset2;;
  3) start2=$onset3;;
  4) start2=$onset4;;
  5) start2=$onset5;;
  6) start2=$onset6;;
  7) start2=$onset7;;
  8) start2=$onset8;;
  9) start2=$onset9;;
 10) start2=$onset10;;
 11) start2=$onset11;;
 12) start2=$onset12;;
 13) start2=$onset13;;
 14) start2=$onset14;;
 15) start2=$onset15;;
 16) start2=$onset16;;
esac
end2=`expr $start2 + $duration`

if [ -n "$showint" ]
  then
  start1=1
  end1=4
  start2=1
  end2=4
fi

if [ -z "$start1" ]
  then
  echo "Start1 never set so exit"
  exit 1
elif [ -z "$start2" ]
  then
  echo "Start2 never set so exit"
  exit 2
fi

##### Now, set up the run string for the progr #####

epicommand="\n\
        -f ${MAPRODXN}/andy3/${thedate}/geom/${sockgeom}.fac \n\
	-as 40 440 551 950 \n\
	-t ${epilead} \n\
	-at 840 1240 825 950 \n $corfile \n\
	-p data/${datafile}.data@${run1} -s $start1 $end1 \n\
	-cl ${ROBHOME}/torso/geom/socks/sock64/sock64.channels \n\
	-sl 2 \n\
	-f ${MAPRODXN}/andy3/${thedate}/geom/${sockgeom}.fac \n\
	-as 441 840 551 950 \n\
	-t ${epilead} \n\
	-at 840 1240 700 825 \n $corfile \n\
	-p data/${datafile}.data@${run2} -s $start2 $end2 \n\
	-cl ${ROBHOME}/torso/geom/socks/sock64/sock64.channels \n\
	-sl 2"

torsocommand="\n\
	-f ${ROBHOME}/torso/geom/andy3/leadset1.fac \n\
	-as 40 440 150 550 \n\
	-t ${torsolead} \n\
	-at 840 1240 400 525 \n $vleadsfile \n\
	-p data/${datafile}.data@${run1} -s $start1 $end1 \n\
	-cl ${ROBHOME}/torso/geom/andy3/leadset1.channels \n\
	-sl 4 \n\
	-f ${ROBHOME}/torso/geom/andy3/leadset1.fac \n\
	-as 441 840 150 550 \n\
	-t ${torsolead} \n\
	-at 840 1240 275 400 \n $vleadsfile \n\
	-p data/${datafile}.data@${run2} -s $start2 $end2 \n\
	-cl ${ROBHOME}/torso/geom/andy3/leadset1.channels \n\
	-sl 4 "

if [ "$epionly" ]
  then
  command="${MAP3D} -nw -b $epicommand"
elif [ "$torsoonly" ]
  then
  command="${MAP3D} -nw -b $torsocommand"
else
  command="${MAP3D} -nw -b $epicommand $torsocommand"
fi

##### And, finally, run the program #####
echo "Run program as $command"
$command
The easiest way to use map3dgl for complicated sets of surfaces and/or
potentials files is to set up a script file. The composition of script
files is described in Section 10 in more detail. Examples
of such files are given in the directory macleod/gl/demos. Any of these
can be executed simply by typing the filename in a window on the SGI
console. These files can also be copied and altered by anyone wishing to
experiment with their own data. Examples of data files, both geometry and
potential data, are to be found in subdirectories of macleod/gl/cj/, eg,. cjb18 in multi/:
# A demo script to look at a set of surfaces
cd ~macleod/torso/geom/dal
map3d -f daltorso.fac -f dalepi.fac
Also check in the directory macleod/gl/demos on one of the new data disks of the SGI for other, and sometimes more stable (and stale?) , demo scripts.
Here is a set of command line examples that all run the same data, and show some of the variability that is possible with map3dgl. All three examples access the geometry in the file mapdata/bt25mar92.geom and the data in the file bt25mar92-1.data, which we assume are stored in mapdata (home directory for the data account for Bruno Taccardi's group).
Version 1:
map3d  -f ~mapdata/bt25mar92.geom \
       -dp /vax/odisk0/bt25mar92pack/ \
       -p ~mapdata/bt25mar92-1.data
Note the use of ~mapdata to specify the home directory of
the user (mapdata in this case), a good way to achieve some independence of
which computer is actually running the script.
The data file for this example is assumed to be on the optical disk #0 an is set by the -dp option.
In this example, the geometry file is explicitly specified, which requires that we know the name of the geometry file for the particular .data file. It turns out that the .data file knows this already for us. But the geometry filename specified in the .data file has no directory and if the script is not run from mapdata's directory, map3dgl will not find the geometry file. We need a way to tell map3dgl that the geometry file is to be found elsewhere. We can state this explicitly, using the method above, or more generally, as shown in the next version.
Version 2:
map3d  -dp /vax/odisk0/bt25mar92pack/ \
	-gp ~mapdata/ \
	-f ~mapdata/bt25mar92-1.data
Here we use the -gp mapdata line to tell map3dgl that any geometry file(s) listed in a .data file are to be found in mapdata's home directory.
The other thing to note in both these examples is that the directory in which the data files are to be found has been redirected to vax/odisk0/bt25mar92pack. This does not mean that the .data file is located here (the -p line in version 1 and the -p line in version 2 indicate where the .data file is located) but tells map3dgl that the directory where the .pak files that contain the actual numerical data is not the same as the one specified for the .data file. Instead, the .pak files can be found in /vax/odisk0/bt26mar92pack/, an optical disk on the Vax. The purpose of this is to gain flexibility in where the individual .pak (or .raw) files are located. You do not have to move files from the optical disk to the disk, for example, in order to read them with map3dgl.
A third version of the script does the same as version 2.
Version 3:
map3d  -f ~mapdata/bt25mar92-1.data \
	-dp /vax/odisk0/bt25mar92pack/ \
	-gp ~mapdata/
The difference here is that the -dp and -gp arguments can be located either before the first -f filename, in which case they apply globally to all subsequent surfaces, or after the -f filename to which they should apply.
Another, even simpler form of the script could be used if we first specify an environmental variable to direct the search for .geom and .pak files.
Version 4:
To have this one work, you must have environmental variables specified as
eli:macleod> echo $MAP3D_DATAPATH
/vax/odisk0/bt25mar92pack/
eli:macleod> echo $MAP3D_GEOMPATH
/vis/u/mapdata/
With these both set, then the map3dgl command becomes even simpler.
${HOME}/gl/cj/map3d -f ~mapdata/bt25mar92-1.data
These environmental variables can be set from within a script, or manually, and the method used depends on the shell you are using for Unix. The most common shell for the CVRTI is the Korn shell (ksh) and the method used here would be
     MAP3D_DATAPATH=/vax/odisk0/bt25mar92pack/
     export MAP3D_DATAPATH
     MAP3D_GEOMPATH=/vis/u/mapdata/
     export MAP3D_GEOMPATH
or for the C-shell (if you insist)
setenv MAP3D_DATAPATH /vax/odisk0/bt25mar92pack
A further way to achieve the same end would be to define a defaults file (see .map3drc file in section 4.1) with the lines
geomfile_path = /vis/u/mapdata/
datafile_path = /vax/odisk0/bt25mar93pack/
And still another would be to use Phil's odisk program to interactively select the location of the .pak/.raw files. Just enter ``odisk'' from the console of either SGI workstation and select the optical disk, directory, and a single file from the list.
So, as always, there is more than one way to skin the cat, and you need only select the one that seems simplest to you.
The following directories contain data files (geometries and potentials) which can be used to play with map3dgl. They are all subdirectores of macleod/gl/map3d and are read-accessible by anyone, and may even contain some bits of documentation as to what they are (but don't count on it).
To many to even begin to contemplate. But if there are any you would like exterminated, see Rob MacLeod (macleod@cvrti.utah.edu) (I accept all foreign currency in large denominations but no credit cards).
This document was generated using the LaTeX2HTML translator Version 99.2beta6 (1.42)
Copyright © 1993, 1994, 1995, 1996,
Nikos Drakos,
Computer Based Learning Unit, University of Leeds.
Copyright © 1997, 1998, 1999,
Ross Moore,
Mathematics Department, Macquarie University, Sydney.
The command line arguments were:
latex2html -split 3 -no_white -link 3 -no_navigation -no_math -html_version 3.2,math -show_section_numbers map3d-manual
The translation was initiated by Rob MacLeod on 2002-02-21