To Do List for map3d
Rob MacLeod and Bryan Worthen
March 17, 2005
Here is what we hope will be a dynamic list of needs, wishes, and dreams for
map3d. The latest version 6 is a big improvement, and we are almost
to the capabilities of the old map3dGL and have many new ones that
map3dGL will never enjoy.
- Nothing; the program is perfect! (See bugzilla to dispell this
illusion).
From the list below, here are our current top picks for things to do. This
list, last updated on March 17, 2005, lists first a number of ``small''
items, and then a few of the larger pieces we would like to tackle in the
near future. See the more detailed list and the background sections below.
- Release source code version of map3d; include all necessary
libraries and some documentation about how to make the program.
Especially, make it clear that we have no facility to support changes;
people can send things to us but we will have to evaluate their value
before merging with the release version.
- Allow coloring of the nodes to match value.
- Allow some control over the number of significant digits get
displayed when marking values on nodes or in scale bar.
- Add support for creating visualization geometry from a landmark
file.
- Add support for labels in landmark file.
- In reponse to another of Ed Ciaccio's comments, we should find a
way to recycle the colors for data sets that span a large range,
typically of activation times. This arises when map3d sees
multiple beats in a single data file and the user wishes to see
activation times for the series. The solution Ed suggested was to
reuse the colors. What we need to figure out is how to control this
and let the user determine what range of data values maps to each pass
through the colors.
- It may be time to consider a new interface to the clipping plans;
as a start, we could have one clipping plane appear by default in the
x-y screen plane, i.e., always cut the object at z=0 relative to the
screen. Then the other could do the same in another plane, perhaps
x-z. And perhaps we need some other way to control the plane, perhaps
rotate it rather than the object? Ideas?
- Continue to develop the visualization of time series attributes,
e.g., activation and recovery times together with time signals.
- Play with state saving and sript generation (Rob)
- Multiseries data file in .mat files
- Some features do not indicate their state i.e., whether it is
turned on or not. (Bryan)
- Test: function to parse filenames and extract the experiment
data and run number, which is encoded into the filenames for all tsdf
files. Then use this information where we do labelling. (RSM)
- Add iconify/maximize for all surfaces at
once rather than each surface
- Put the arrows on landmark fibers. (status??)
- Investigate some new color maps that have less green/yellow and use
more colors in their place.
- Support for script writing in which the user can save current
settings and layout in a script file for rerunning or editing. This
needs more testing and perhaps some user driven selection of content;
it is a little too inclusive at present.
- Restore use of report level throughout the code and allow user to
select it from a menu.
- (Done)Mac installation
- (Done)Frame control(set time to zero)
- (Done)Reference leads
- (Done)Pick Window more detailed info toggle
- Matlab file format
- (Done) Matlab file usage
- (Done) 'w' key to save image quickly
- (Done) more details on image saving dialog
- (Done) CTRL+SHIFT can be substituted for ALT
- (Done) script saving
- (Done) state saving
- (Done) new version of gouraud shading (textures) + method of reverting
- (Done) bug fixes: image saving (and many unknown ones)
Here is a list in outline form of some more things in the waiting list.
See the background sections below for more details.
- Dynamic waterfall plots of two-dimensional datasets on irregular
grids.
- ``Video display'' options to thicken lines and increase font
sizes or remove unnecessary lettering.
- Provide user options, via the command line and eventually a menu to
enter text strings to show in the displayed material for the
surface windows. This would allow the user to make some labels for
the displays.
- Vector field visualization.
- Stereo viewing and VR control.
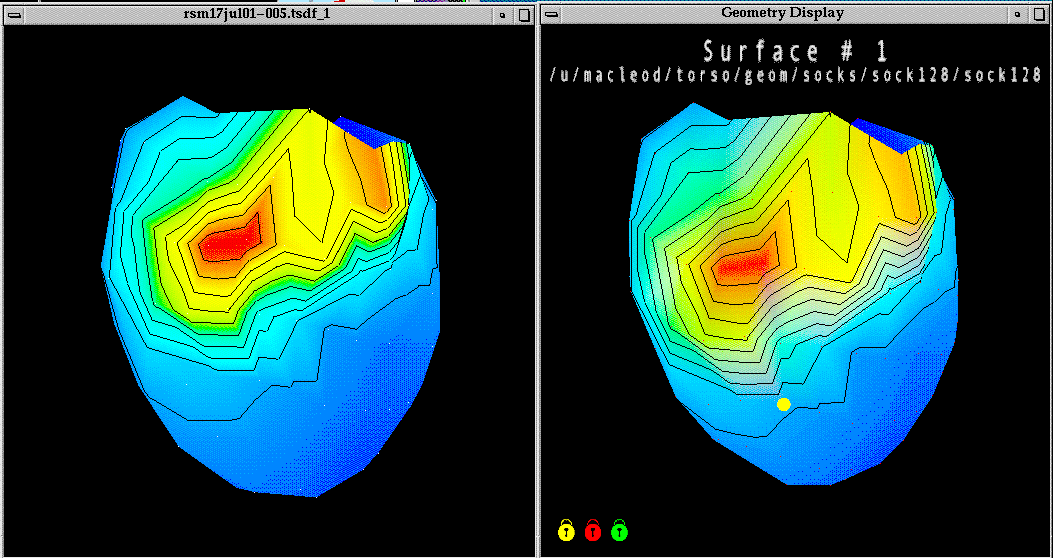
Figure 1:
Comparison of color mapping between old
(left) and new (right) map3d.
 |
- Window placement at start up or when launching new time series
window.
- Control of lighting model
- Remote control of animations.
- When saving the mesh, there appears to be a bug in the way the
meshes are saved; the main need here is to adjust a mesh and then
save it with that adjustment. The ambiguity arises with what we
mean by adjustment. One would like to be able to move one surface
relative the other and then save the moved mesh with just the
transformations applied relative to the other geometry. It
appears now that moving just one surface and save the results
leads to both surfaces being transformed-and even then, their
relative position is not preserved.
- Use feedback mode to capture screen contents as vector based
postscript.
- When specified without extension, the program should look for
sensible file extensions and complete them if possible; right now
it does this for the first surface of a multisurface plot but
then fails on the others.
- Make some new screen dumps from the scalar display for the
manual.
- Check on the controls available for landmarks and update
controls.TEX accordingly.
3.5 Miscellaneous
- Display of text in main window:
- When only geometry available, print the geometry file name.
- When potentials and geometry available, print the data file
name.
- If more than on surface present, but only geometries, if
the surfaces all came from the same .geom file, print that;
if they come from 2-3 files, print all of them; if more
than 3 files, print first with a ``+ others'' below it.
- If more than one surface present with potentials, try and
print all the potentials filenames (may need to eventually
limit this but it should not be a real problem).
- Make sure to parse all filenames so that they show either
no path or at most the last part element.
- Window attributes->Size: remove the present options and replace
them with: fixed aspect ratio and variable aspect ratio and
then provide a list of standard window sizes like 400 by 400,
640 by 480, 1024 by 768, etc.
4.1 Scaling options
There is a wide variety of options available for mapping scalar values to
colour and contour levels. One can picture the process as based on four
facets:
- Extrema:
- the extrema of the data and the selected colour maps
determine the basic parameters of how value maps to color. map3d
maintains a detailed list of data extrema organized both by time
signal, time instant and by surface. Thus it is possible to determine
extrema based on just the most local of conditions--a particular
frame and surface--or by more global conditions--the full range
of frames or the full set of surfaces.
- Scaling function:
- the mapping between value and color occurs
according to some mathematical function, the simplest of which
is linear. The scaling function uses the selected extrema and
describes a complete mapping between value and color.
- Mapping:
- by scale mapping, we mean how the translation from
value to color treats positive and negative values. We may choose
to map uniformly between the extrema or to apply different
extrema or functions to the positive and negative values.
- Color maps:
- the color displayed for a particular scalar value
depends on the actual range of colors and their order in the color
map.
map3d can adjust all four facets of the scaling to create a wide range of
displays. We chose to limit some of these options, however, in an effort
to create reproducible displays that reflect standard within the field. Of
course, we chose our field, electrocardiography, as the basis, a fact for
which we make no apologies and simply encourage others to make similar
choices for their own field and implement map3d accordingly. Subsequent
versions of map3d will support this flexibility.
Below are the specific choices that map3d offers to control data scaling
and display
- Scale range
- map3d supports several selections of range over
which to look for extrema. In local range, only the data
presently visible
are scanned for extrema--this is the default. In the full global range, all the data in the entire dataset are used, even
those not presently visible on the display. In between these
cases, one can have global in time and local in space, i.e., we
scale each surface separately but use all time values for that
surface. Or one can
select local in time and global in space, in which map3d scans all
surfaces for the data extrema, but for each time instant separately
The user scaling scope uses the current user-selected
values for maximum and minimum for the scaling (see -pl and
-ph input parameters.
- Scale function
- The scale model describes the way in which scalar data
are mapped to colours (or contours). The present choice is linear,
but the next version of map3d will include: linear model,
which simply maps the data to a range of colours in a completely
linear fashion, i.e.,
colour = K
 ; the
logarithmic model, which highlights the lower level data
values at the cost of poorer resolution at the higher levels i.e.,
colour = A log() + B; and the exponential
model, which does the opposite, compressing the smaller levels and
expanding the higher ones to span a wider colour range, i.e.,
colour = AeB
; the
logarithmic model, which highlights the lower level data
values at the cost of poorer resolution at the higher levels i.e.,
colour = A log() + B; and the exponential
model, which does the opposite, compressing the smaller levels and
expanding the higher ones to span a wider colour range, i.e.,
colour = AeB .
.
- Scale Mapping
- There are several different ways to manage
the way positive and negative data are treated in the scaling
transformations in map3d. The current version supports the
simplest, or true mapping, in which the data are used as
they are with no consideration of positive or negative values--the
color map spreads evenly across the range of the extrema.
Subsequent versions will support the symmetric scale
mapping, which sets the positive and negative extrema
symmetrically--the larger (in the absolute value sense) determines
both maximum and minimum data values. Also to appear in the net
version is the separate scale mapping, in which the
positive and negative extrema are treated completely
separately--`half' the colours (and contours) are used for the
positive values, half for the negative values. This is equivalent
to producing maps with the same number of contours for both
positive and negative values, even when the positive data have a
different absolute maximum value than the negative data.
- Contour spacing
- the contour values are a function of the data and
the user selection of scale range, model, and mapping (see following
items). Fundamentally, the user selects between contour spacing
based on the number of contours selected or based on fixed spacing
between contours. The actual result depends, in turn, on the range
of data values and the desired mapping between value and colour.
To Do List for map3d
This document was generated using the
LaTeX2HTML translator Version 2002-2-1 (1.70)
Copyright © 1993, 1994, 1995, 1996,
Nikos Drakos,
Computer Based Learning Unit, University of Leeds.
Copyright © 1997, 1998, 1999,
Ross Moore,
Mathematics Department, Macquarie University, Sydney.
The command line arguments were:
latex2html -split 3 -no_white -link 3 -no_navigation -no_math -html_version 3.2,math -show_section_numbers -local_icons todolist
The translation was initiated by Rob Macleod on 2005-03-17
Rob Macleod
2005-03-17