Control of Contraction of the Frog Heart
This lab builds on the previous one using the same basic preparation of the
exposed frog heart to which we attach a force transducer to measure
contraction. In this lab, we also measure the ECG to provide a measure of
the heart's electrical activity and then apply a series of drugs to the
heart. The goal is to investigate the response of the heart to a series of
substances, many of which arise in the normal function of the frog.
Background for the preparation is the same as for the previous lab so please
see that for pointers.
1.3 Materials
The equipment required consists of:
- Digital camera to take photos of the frog during dissection
- Dissection pan with 4 needles
- Dissection kit you used in the anatomy experiment.
- Two bioamplifiers
- Force transducer
- 2 magnetic clamp stands
- Bipolar electrode
- Oscilloscope
- Computer with acquisition program (
C:\\bioen\CB8ChScope)
- 20 ml vials for drug samples
- Plastic eye-droppers
- suture needle with thread attached
- Batteries for the force transducer
- medium sized vial containing Ringer's solution,
composed of:
- NaCl: 200 ml (stock 4M),
- KCl: 20 ml (stock 1M),
-
MgCl2
: 20 ml (stock 1M),
-
CaCl2
: 4 ml (stock 1 M),
- NaOH: 25.8 ml (stock 1 M)
- D-Glucose: 1.8 g,
- Hepes: 11.44 ml (stock 1 M),
- pH: 7.4,
- De-ionized water: to make 2 L,
- Total Volume: 2 L.
- Set of drugs to evaluate (and their dosages):
- AcetylCholine: 1, 5 and 10 mM
- Atropine: 1 mg/ml
- Cadmium Chloride: 0.5 mM
- Caffeine: 30 mM
- Cold Ringer's solution
- Epinephrine: 50 uM
- KCl: 1 M
Each of the drugs you will apply in the lab will have some effect on the
function of the heart, one that usually relates to the response of
individual cardiac cells to the drug. See the list of drugs below and your
class notes and support text for explanations of the expect response to
each drug.
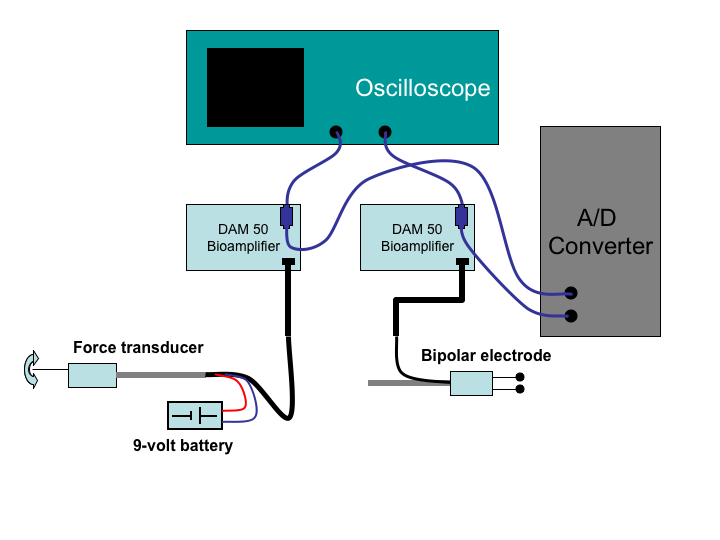
Figure 1:
Circuit diagram for the recording of
contraction and electrograms from the frog heart.
 |
Please carry out the following steps--these are the same steps as in the
previous lab. Figure 1 shows the circuit diagram. (Note
Do not start the frog dissection until you have completed all the
setup steps!):
- Setting up the measurement circuit:
- Connect the battery to the pressure transducer and hook up
the wires from it to the input of one of the bioamplifiers.
- Place a T-connector on the output of the bioamplifier and
then connect one end to the input of the oscilloscope and
the other to the inputs for the computer A/D converter.
Use channel one for both the oscilloscope and A/D converter.
- Adjust the settings on the bioamplifier to get a clean
signal on the oscilloscope in which you can see
gentle bending of the force transducer. Start with
the following settings on the bioamplifier:
- DC coupling
- Low filter at lowest frequency setting
- High filter at low to moderate frequency
- Gain at or near maximum
On the oscilloscope, try the following settings (make sure
all settings are in calibrated mode, i.e., latched into fixed
settings):
- DC coupling
- 1 Volt/div
 0.5 s/div
- Launch the acquisition program (
C:\bioen\CB8ChanScop)
computers for acquiring the signals. Then select sampling
parameters from the program (sampling rate of 100-200 is adequate)
and run it to make sure it acquires signal.
- Calibration of the force transducer:
- Instead of the full calibration procedure, carry out a single
sensitivity measurement with about 2 g of paper clips and note the
resulting voltage change. Note this value in your lab report.
Once you have everything set up and the force transducer calibrated, you
can move on to the frog preparation as follows (again, just as in the
previous lab):
Figure 2:
Photo of the complete frog preparation.
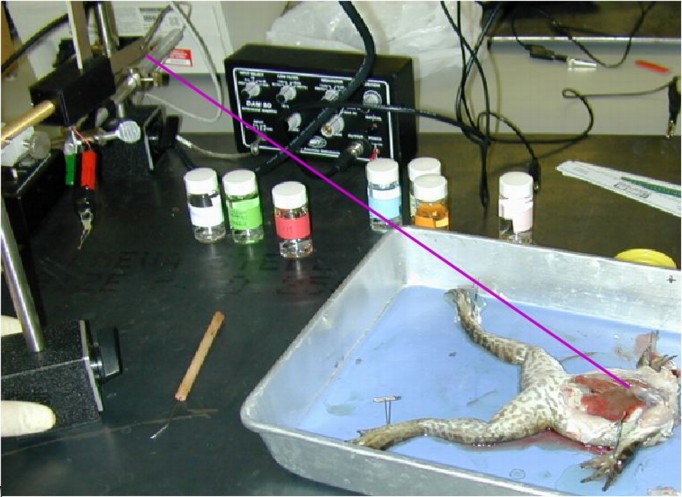 |
- Obtain a pithed frog from the lab TA/Instructor and fix the frog on
its back using the big needles in the pan.
- To expose the heart, make sure to remove the lower and middle
sections of the rib cage as they will interfere with the transducer you
will use to measure contraction.
- Once the heart is open, regular apply a few drops of Ringer's
solution to keep is moist.
- Attaching transducer to the frog (See Figure 2):
- Very carefully, cut open and remove the pericardium from the
heart so you can see it fully exposed.
- Using the curved needle and suture provided, run the needle
through the lower part of the ventricle, about 5 mm from
the apex of the heart, and tie a loop with the suture
thread. Run the other end of the suture through the hole
in the transducer blade and tie a knot there as well.
- Place the transducer at the end of the pan, elevated about
about 20 cm above the table surface with the blade oriented
perpendicular to the thread that connects it to the heart. The
thread from the frog heart to the transducer should be relatively
flat (horizontal) (see Figure 2 for reference).
- Apply a ground wire between the metal dissection tray and the
large metal plate on which you are working. This should reduce the
noise levels substantially.
- Now apply enough tension to the thread that you start to see a
signal on the oscilloscope that reflects the contraction of the
heart. Sensitivity of the 'scope should be in the range of
1-5 V/div.Adjust locations and tension so as to generate as clean
a signal as possible, ideally one that reveals the separate
components of atrial and ventricular contractions. Make sure the
tension of the thread is just enough to pull the thread taught and
lift the heart slightly, but not that it yanks the heart from the
animal. Check also that there is no obstruction from the side of
the pan or any other object. Place the pan and the stand well away
from the edge of the lab bench and always be careful not to
accidently touch the post or the thread so as not to change the
orientation of lose the reference signals, which will be important
later in the experiment.
- Obtain a record of the normal heart contractions in normal
Ringer's solution. Save it on the computer and as a reference on
the scope display so that you will be able to observe the changes
in heart rate and contraction strength. Repeat this
reference recording before each application of a drug!
Figure 3:
Exposed heart with applied bipolar
electrodes. The electrodes should touch the exposed heart lightly.
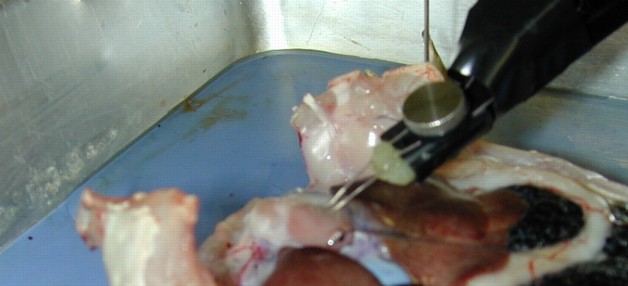 |
Now for the electrogram, the signal one can record directly from the heart
surface, as follows (see Figure 3):
- Arrange a second bioamplifier with the output going to the second
channel of the oscilloscope and the channel 2 of the A/D converter.
- Try the following settings on the bioamplifier:
- AC coupling
- A-B mode
- Low filter at lowest frequency setting
- High filter at low to moderate frequency
- Gain at or near maximum
- Take a bipolar electrode holder, attach it to a magnetic stand that
can lift up and down, and place the electrodes in contact with the
heart surface.
- Connect the wire from the electrode to a bioamplifier. Connect the
reference lead to one of the pins that hold down the feet of the frog.
Adjust the electrode location so as to get a clean signal of both
atrial and ventricular electrograms.
- Record the electrogram together with the contraction signal on the
computer.
For each of the drugs listed below, record first a stable baseline as
control and then apply 2-10 drops of the drug; start small and work up
only if there is no response within a few minutes. After whatever
changes that arise have settled, make a second recording and then wash out
the drug with the Ringer's solution.
Please apply the drugs in the order below, especially the KCl! Make sure
to take control recordings before each application of the drug and make
sure to provide plenty of time an Ringer's solution after each drug to wash
it out.
- Cold Ringers
- Epinephrine
- Cadmium chloride
- Caffeine
- ACh
- Atropine (ask the instructor for this drug)
- KCl
Note the changes you see in the heart after each of the drugs; do not just
trust the computer but rather look at the oscilloscope and at the heart
itself and write down your observations.
Epinephrine and ACh as natural antagonists so if the heart
rate or contraction should drop too low, apply epinephrine as needed to
restore.
From www.rxlist.com/cgi/generic3/atrop_cp.htm:
- Atropine is commonly classified as an anticholinergic or
antiparasympathetic (parasympatholytic) drug. More precisely, however,
it is termed an antimuscarinic agent since it antagonizes the
muscarine-like actions of acetylcholine and other choline esters.
- Atropine inhibits the muscarinic actions of acetylcholine
on structures innervated by postganglionic cholinergic nerves, and on
smooth muscles which respond to endogenous acetylcholine but are not so
innervated. As with other antimuscarinic agents, the major action of
atropine is a competitive or surmountable antagonism which can be
overcome by increasing the concentration of acetylcholine at receptor
sites of the effector organ (e.g.,, by using anticholinesterase agents
which inhibit the enzymatic destruction of acetylcholine). The
receptors antagonized by atropine are the peripheral structures that
are stimulated or inhibited by muscarine (i.e.,, exocrine glands and
smooth and cardiac muscle). Responses to postganglionic cholinergic
nerve stimulation also may be inhibited by atropine but this occurs
less readily than with responses to injected (exogenous) choline
esters.
Combine the lab reports from both the frog labs into a single document that
documents your findings. Include very brief background and methods
sections and concentrate on showing the following:
- Plots of the measured signals, both contraction and ECG, for each
of the drugs, including baseline signals record before each drug
application. (Use MATLAB for these).
- Create a table of all the interventions (drugs) that you applied
and then list the effect of each on 1) heart rate, 2) strength of
contraction, 3) morphology (shape) of contraction signal, and 4)
morphology of the electrogram.
- Attempt to explain the nature and the mechanism of the changes you
observed after application of the drugs.
- Did conditions return to baseline after every intervention? Why
not?
Here are some additional suggestions, most of them general in nature but
illustrated using this lab report as an example. The goal is to develop
your ability to describe what you did, what you saw, and especially
interpret what it might mean. In practical terms, this means a lab report
that contains the following:
- Introduction:
- include a brief statement of the purpose of the
labs. Do not regurgitate the background sections that I provided in
the description but rather try and summarize the important points in
your own words.
- Methods:
- briefly describe the steps in the measurements
you performed; assume you are writing this description for a fellow
student with your level of knowledge in physiology and bioengineering.
Assume they have access to the lab description but are probably not
anxious to read it carefully.
- Results:
- describe in some detail the results of the measurements
and observations you made. Include plots and graphs where appropriate
and for each one, include some text describing the contents. Again,
imagine explaining to fellow students the contents of the
figure/graph/table and draw their attention to the features that you
consider important or meaningful. Do not hesitate to include
observations that are outside the specific tasks or questions in the
lab description, especially if they tie into the discussion below.
- Discussion:
- discuss what your results tell you about the
behavior under examination. Try and focus each part of the discussion
around a specific question or hypothesis and present the evidence for
all the possible answers. For example, we proposed that stretching the
frog heart would increase contraction; do the data support this
presumption? We came up with expectations of the action of all the
drugs you applied to the heart; explain each expectation, briefly the
physiology behind it, and then describe whether your preparation
responded as predicted. If not, speculate about why not and make sure
to give reasons for any speculations?
- Conclusion:
- a short statement of what you think you learned form
the lab.
The tips for homework assignments provided at
www.cvrti.utah.edu/~macleod/bioen/be6000/homeworks/homework-tips.html
also apply to lab reports.
Control of Contraction of the Frog Heart
This document was generated using the
LaTeX2HTML translator Version 2002-2-1 (1.71)
Copyright © 1993, 1994, 1995, 1996,
Nikos Drakos,
Computer Based Learning Unit, University of Leeds.
Copyright © 1997, 1998, 1999,
Ross Moore,
Mathematics Department, Macquarie University, Sydney.
The command line arguments were:
latex2html -split 3 -no_white -link 3 -no_navigation -no_math -html_version 3.2,math -show_section_numbers -local_icons descrip
The translation was initiated by Rob Macleod on 2006-03-29
Rob Macleod
2006-03-29