Dashboard
Dashboard system is developed by the DOE SDM Center in conjunction with the Center for Plasma Edge Simulation (CPES). Dashboards provide multi-view interfaces that allow research scientists to see condensed information about computations in progress, and computations that have been submitted to the batch systems. A dashboard displays the most relevant/interesting information about the domain data (simulation), workflow progress (processes), and environment status (e.g., machine queues, and similar), and perhaps some other information of useful to the end-user.
Abstract of my work
My work is to build user friendly image/video viewer in dashboard. I mainly focused on creating custom grid classes, image classes and anotating images/videos.
Tools used
- Flex 2 using flex builder
- Php
- Flash
Implementation:
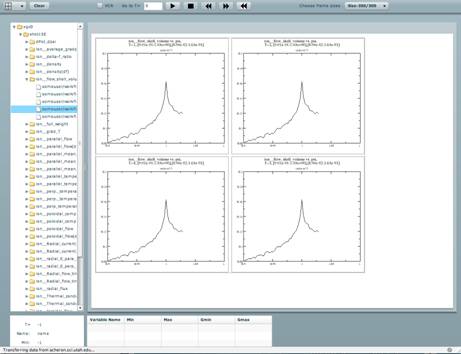
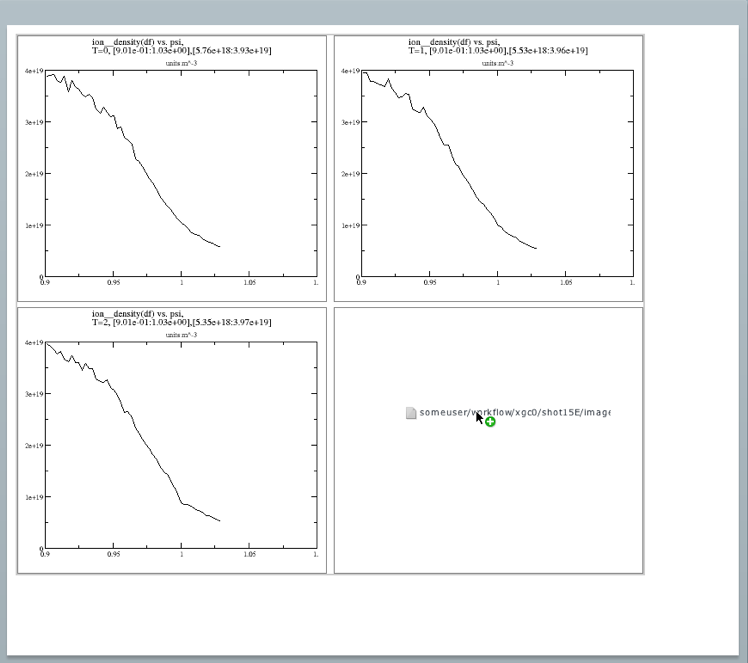
- I have created Custom Grid class, so that user can drop any images or videos by dragging them from the tree, which is placed at the left side of the application.
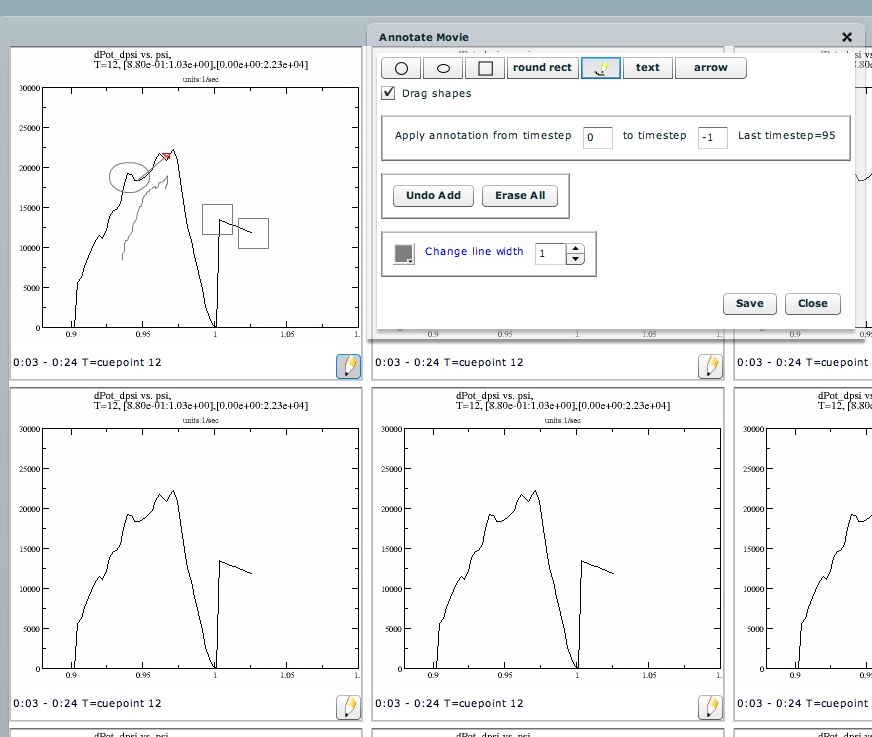
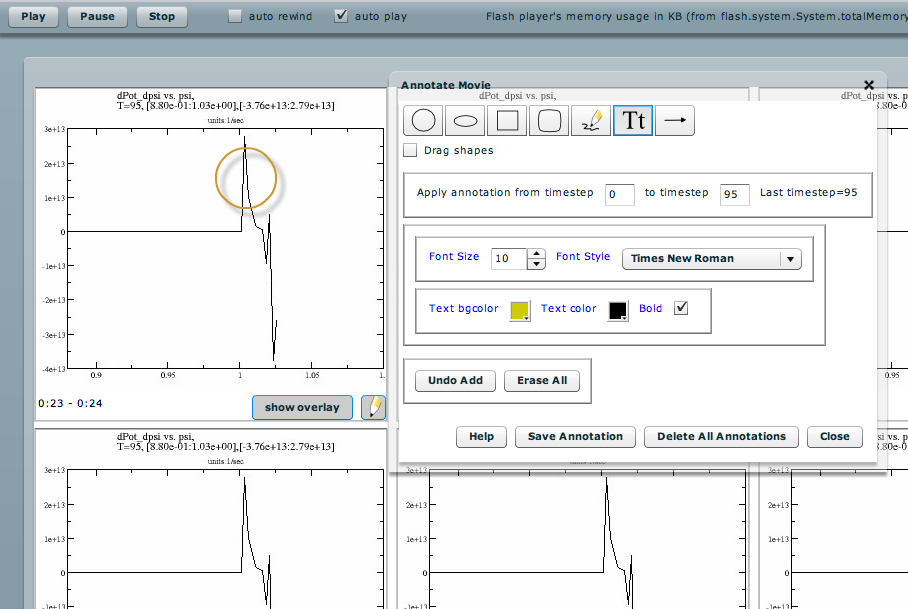
I have created Overlay class to annotate images or videos using Graphics library of Flash.
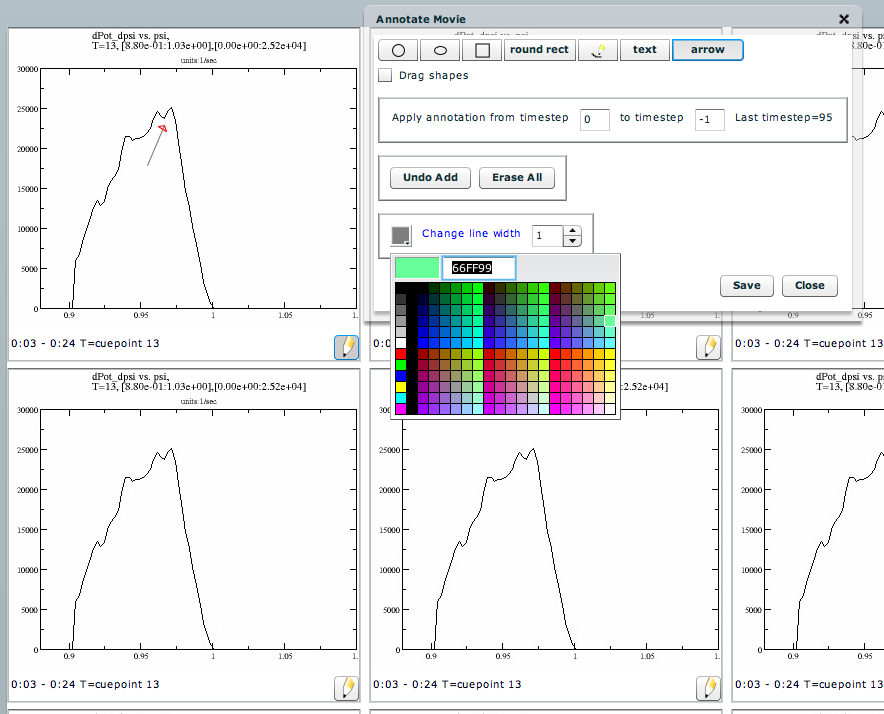
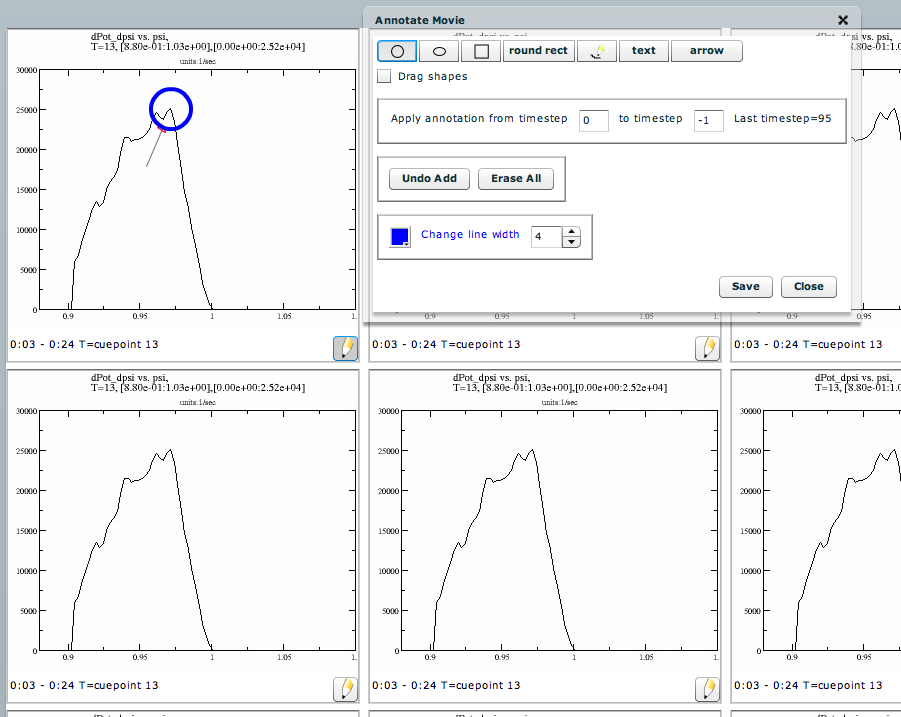
I have added features to the Overlay class, which can help user to insert any cool objects on the images/videos like circle, ellipse, arrows, text, rectangle, round rectangle and any free hand shape.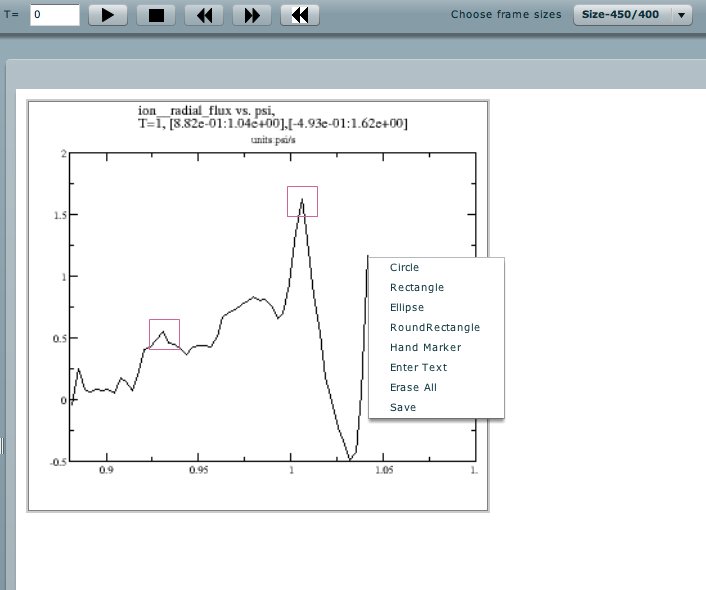
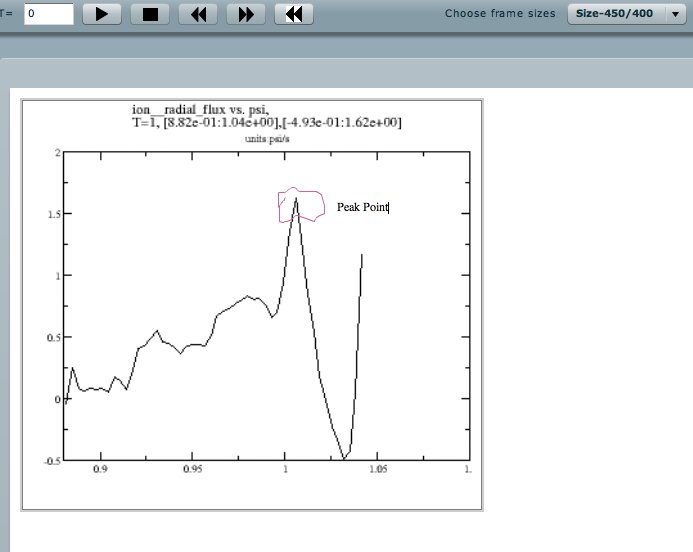
I have added features to the Overlay class, which can help user to do operations like change drawing color, line width, undo previous add operation, delete all added objects, save the present overlay and reapply the previously saved overlay.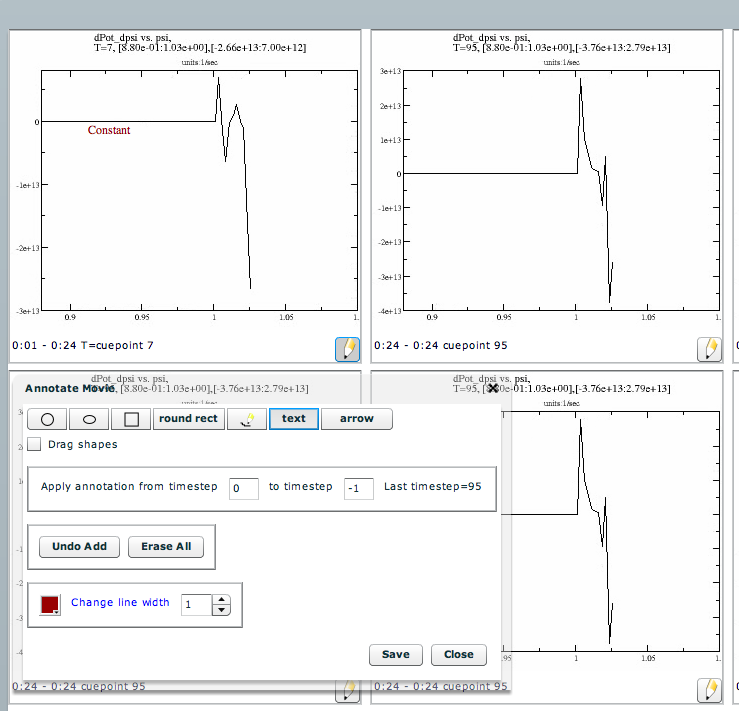
I have also added drag feature to the overlay class, so that the user can add graphics object anywhere and they can drag and place them at whatever place they what.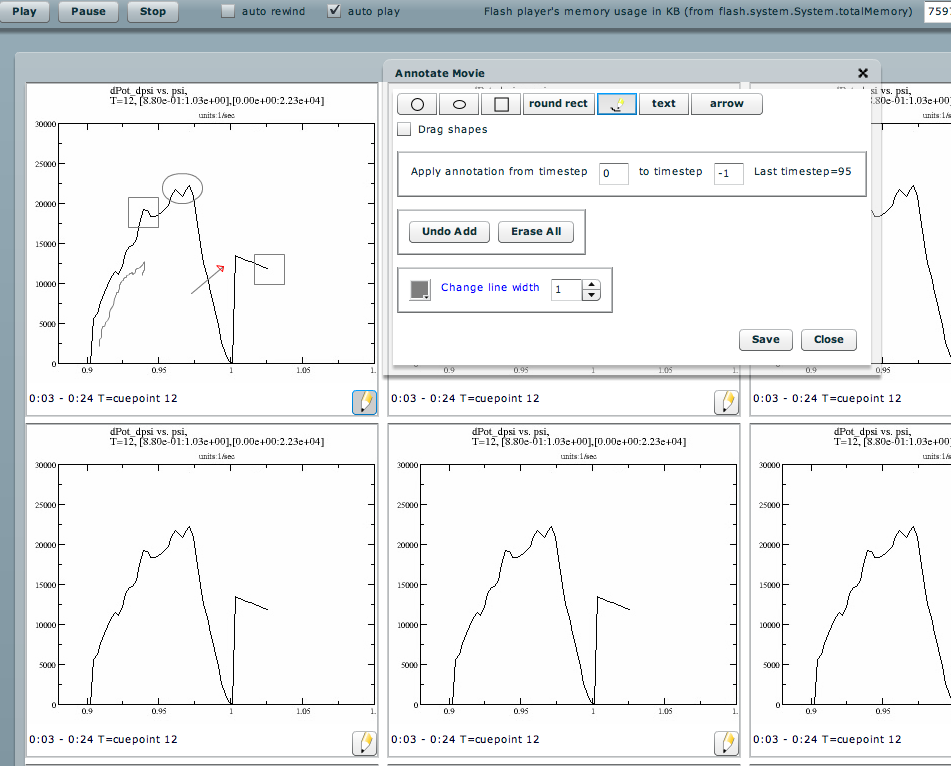

I have also written some php files for file uploading and downloads, so that the user can save the overlay and apply it back whenever they want.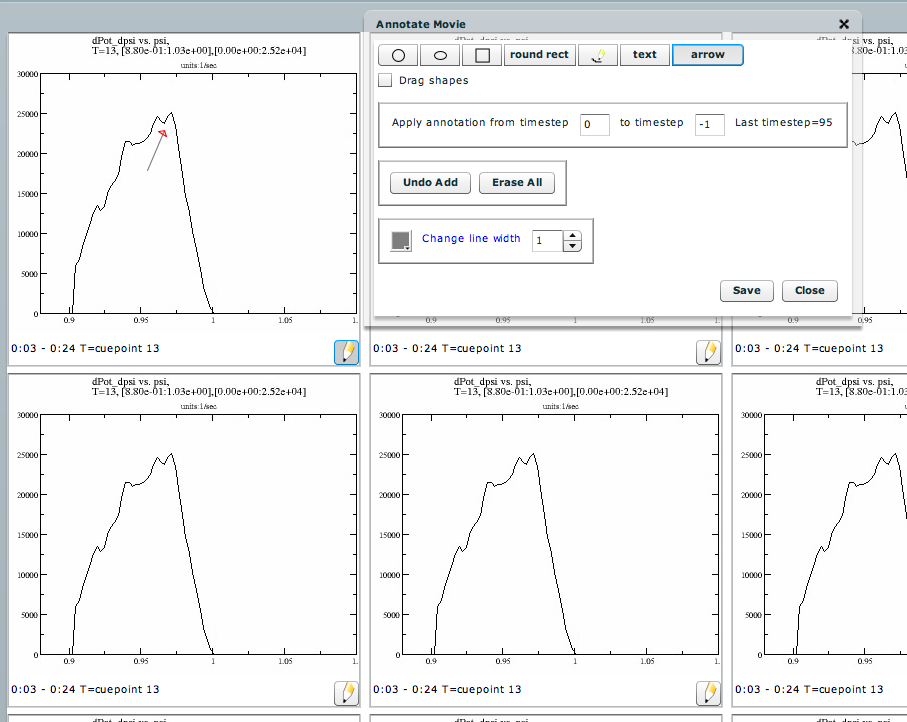
The coolest thing I did was giving drop shadow feature for the overlay objects.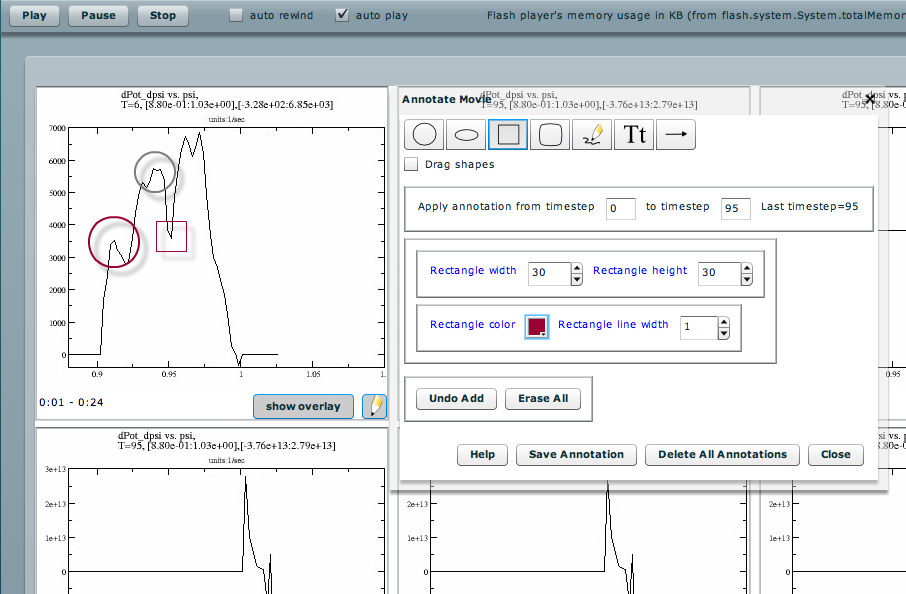
I have also introduced states and implemented state transitions in the application.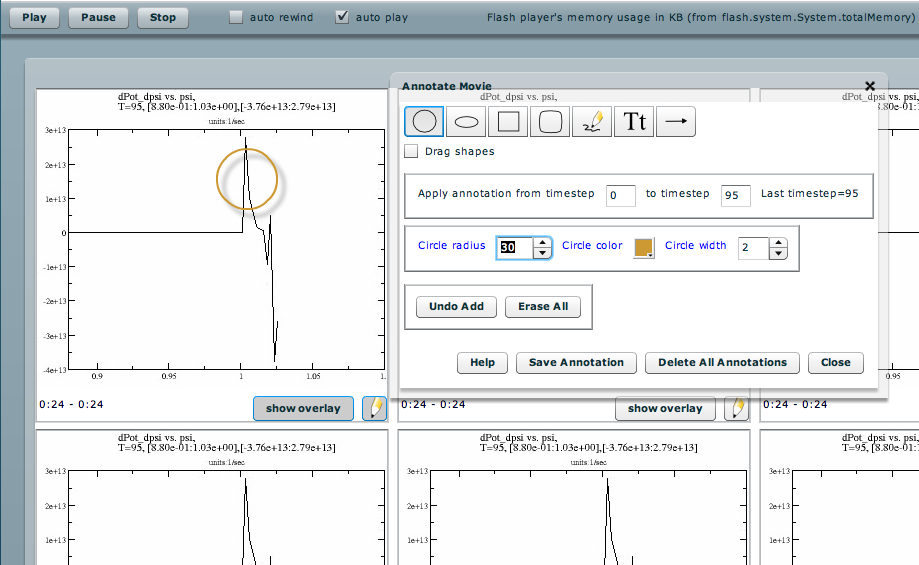
External Links: