Scientific Visualization (CS6630)
In this course I explored techniques and tools needed for the visualizing data resulting from scientific measurements and computations. The emphasis is on using 2D and 3D graphics to gain insights into multidimensional data sets. Topics include visualization software and techniques, human vision, color mapping, data representation, volume rendering, surface extraction and rendering. The textbook I referred was “The Visualization Handbook”, By Charles Hansen and Chris Johnson.
Assignment No1:
Download: Report
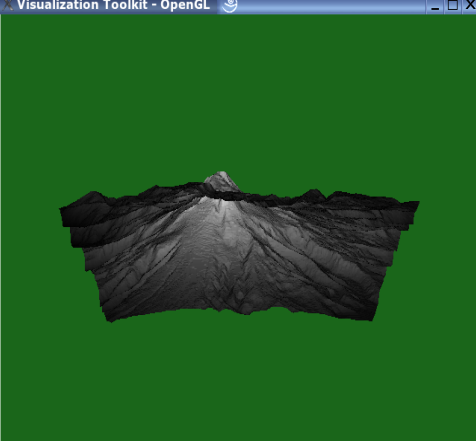
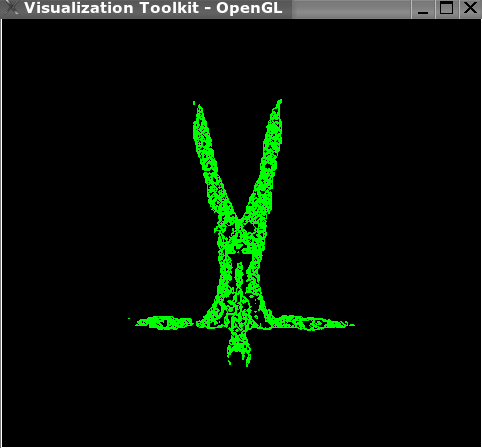
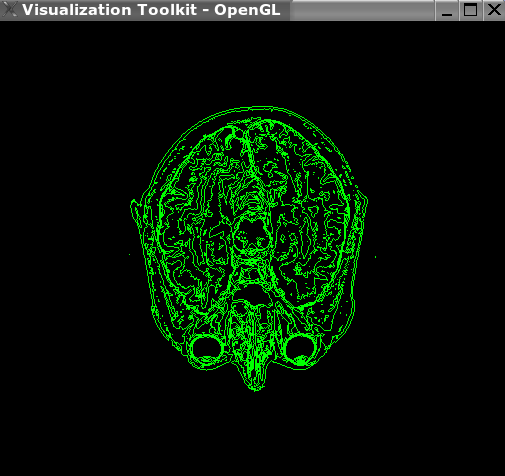
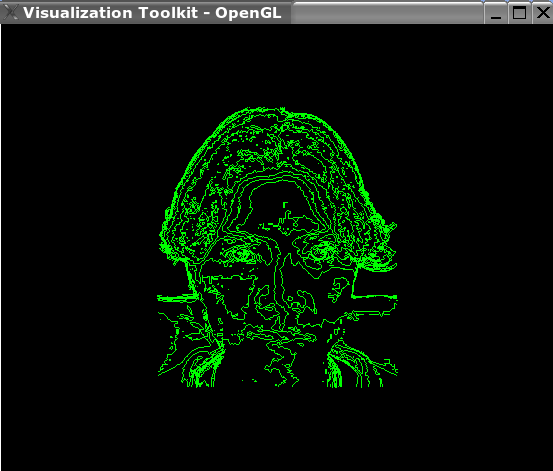
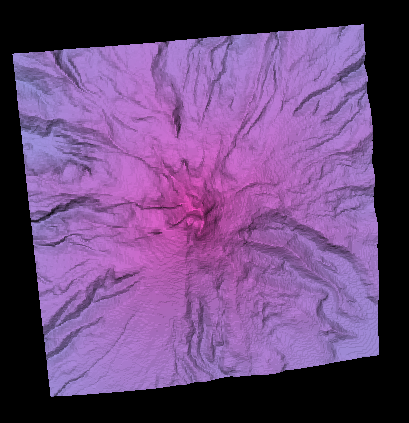
For the assignments I used Tcl/Tk and vtk packages. For the first assignment I was given the data which was a simulation result of the electric field produced by the heart in a slice through a human thorax and elevation data of Mount Hood to visualize both data sets as height fields. I was also given human body and brain data to produce contour maps.
Images generated for this assignment
Assignment No2:
Download: Report
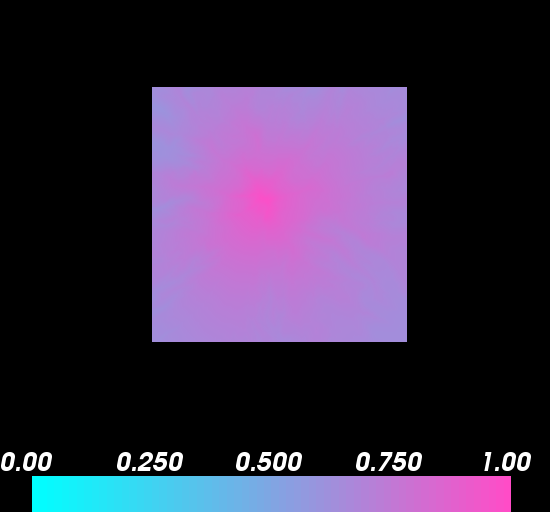
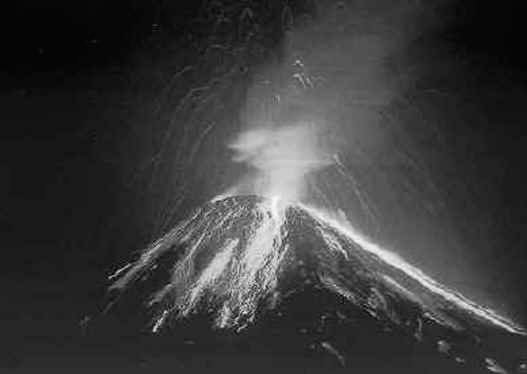
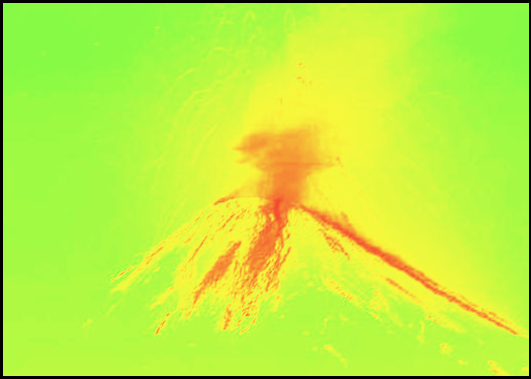
In the second assignment I used univariate colormaps and bivariate colormaps to visualize given data sets.
Images generated for this assignment


Assignment No3:
Download: Report
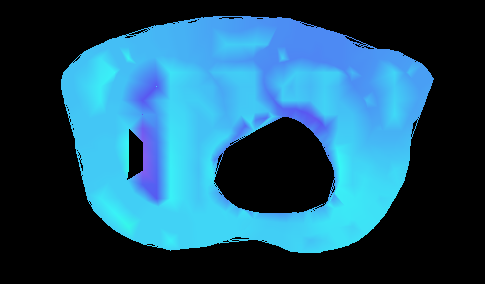
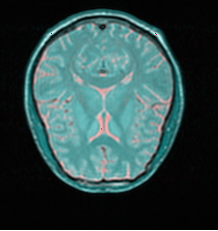
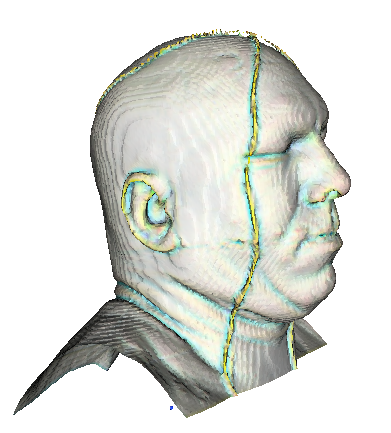
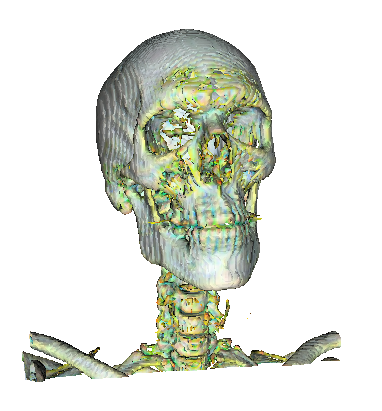
In the third assignment I used vtkContourFilter to isosurface the given volume data sets. I used bivariate color maps to visualize volume data.
Images generated for this assignment

Assignment No4:
Download: Report
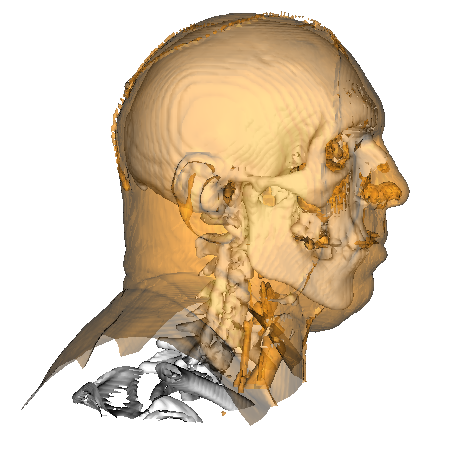
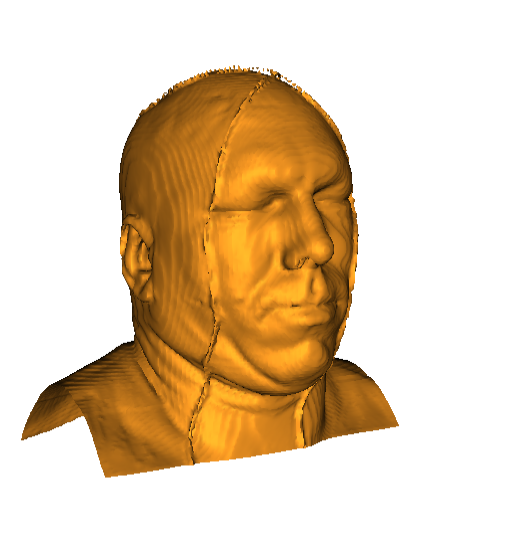
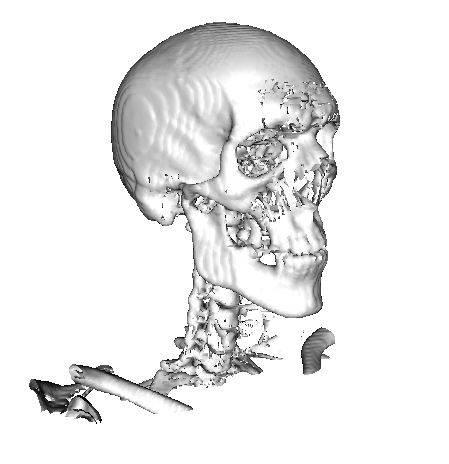
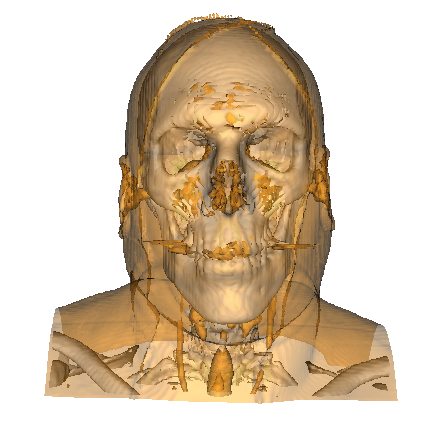
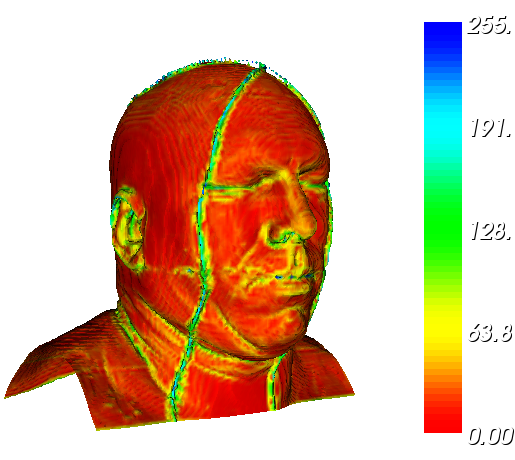
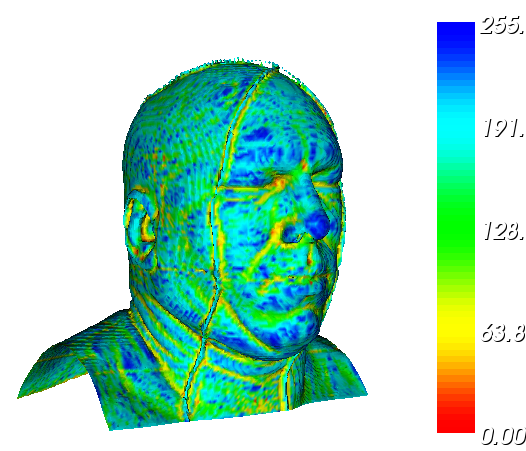
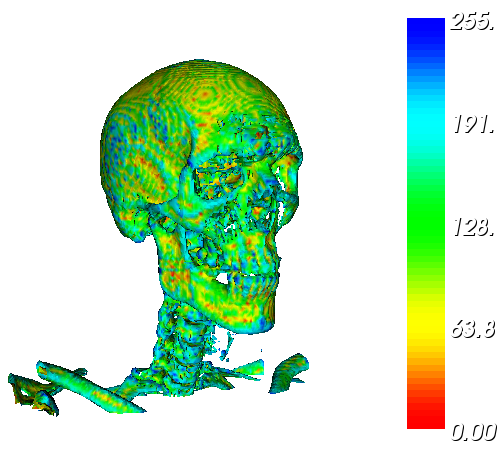
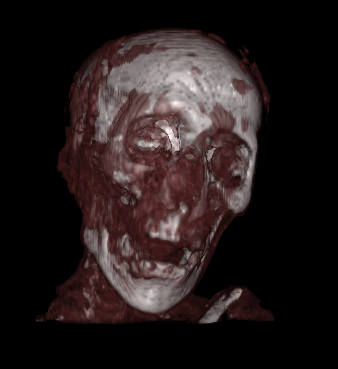
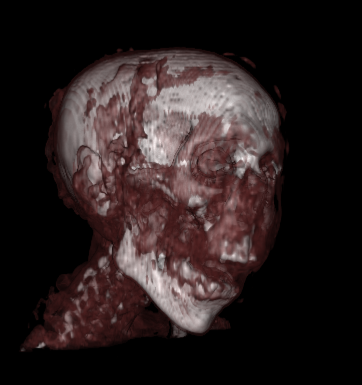
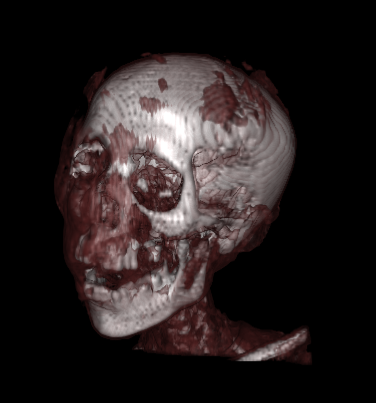
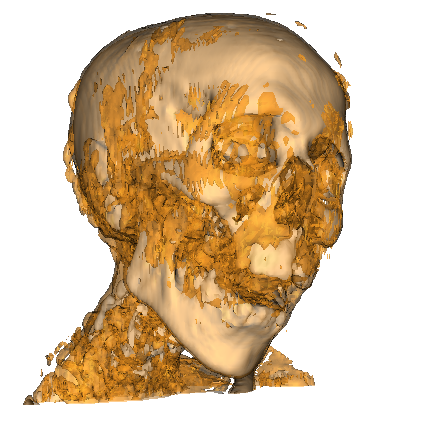
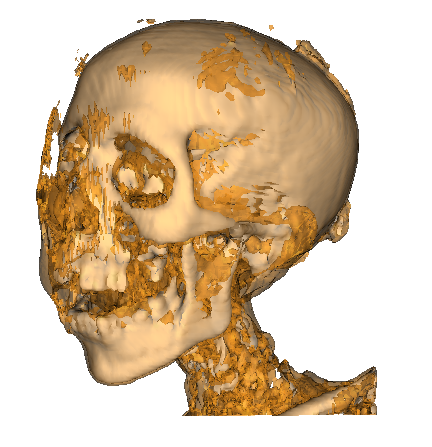
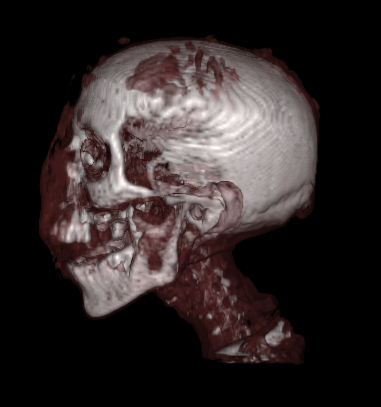
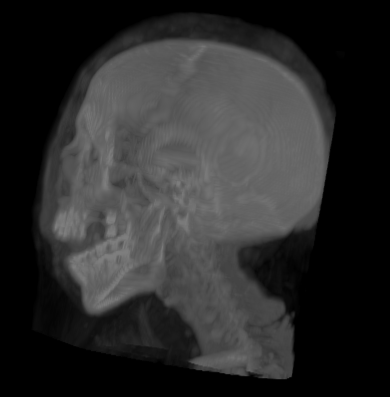
As my fourth assignment I did direct volume renderings of the head of a mummy using transfer functions. I also did MIP(Maximum Intensity Projection) renderings of the given mummy datasets.
Images generated for this assignment
Assignment No5:
Download: Report
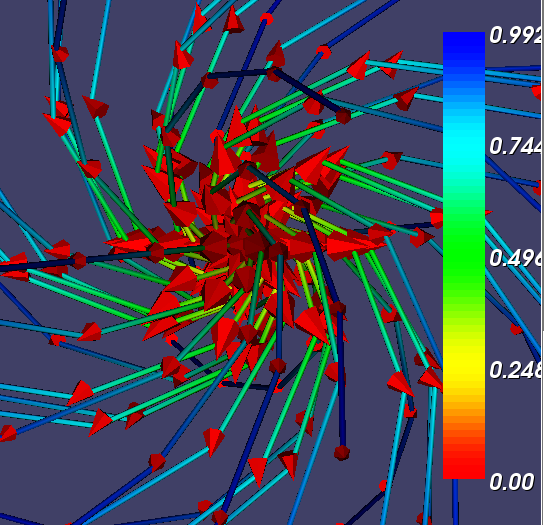
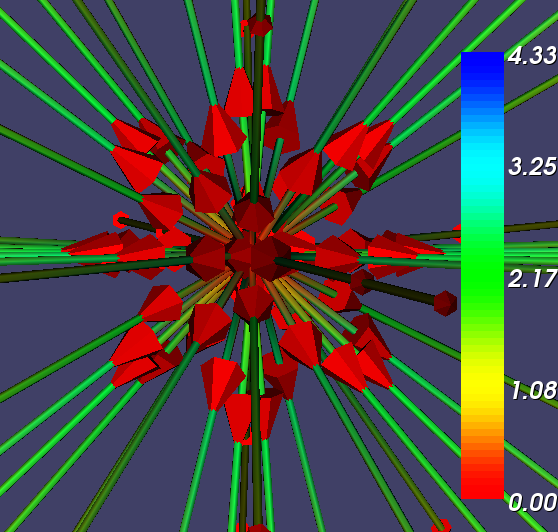
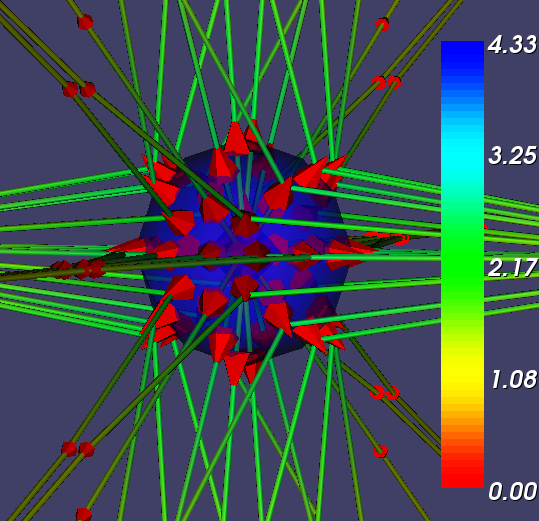
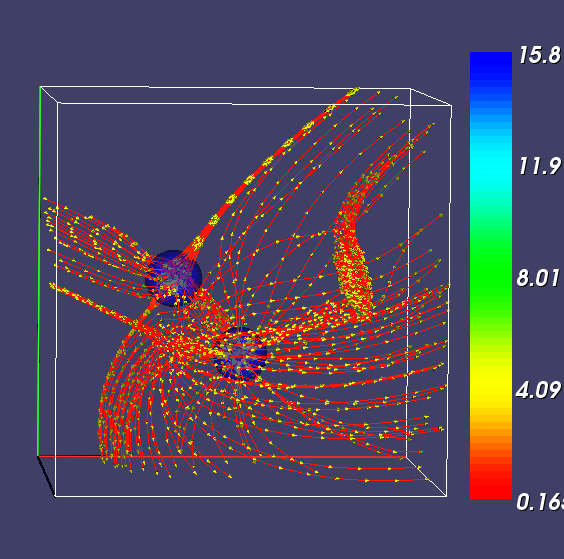
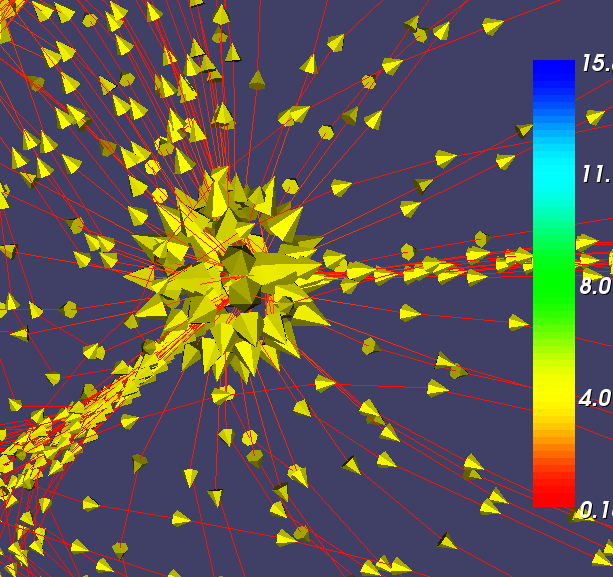
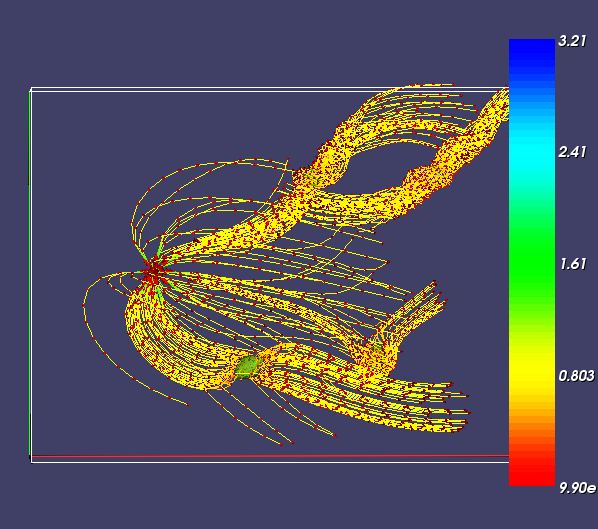
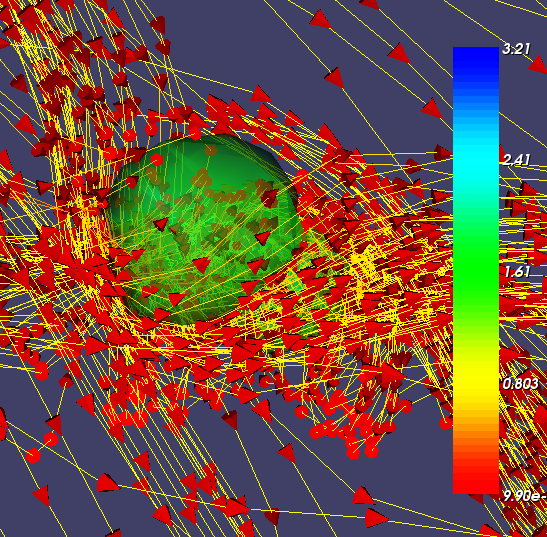
Fifth assignment was to experiment with the vector visualization. I first located critical points by isosurfacing the (scalar) magnitude of the scalar field. Then I visualized the vector volumes using glyphs, streamlines and stream surfaces.
Images generated for this assignment