


SCI Publications
2012


C. Brownlee, J. Patchett, L.-T. Lo, D. DeMarle, C. Mitchell, J. Ahrens, C.D. Hansen.
“A Study of Ray Tracing Large-scale Scientific Data in Parallel Visualization Applications,” In Proceedings of the Eurographics Symposium on Parallel Graphics and Visualization (2012), Edited by H. Childs and T. Kuhlen and F. Marton, pp. 51--60. 2012.
Keywords: kaust, scidac
G. Chen, V. Kwatra, L.-Y. Wei, C.D. Hansen, E. Zhang.
“Design of 2D Time-Varying Vector Fields,” In IEEE Transactions on Visualization and Computer Graphics TVCG, Vol. 18, No. 10, pp. 1717--1730. 2012.
DOI: 10.1109/TVCG.2011.290
M. Kim, G. Chen, C.D. Hansen.
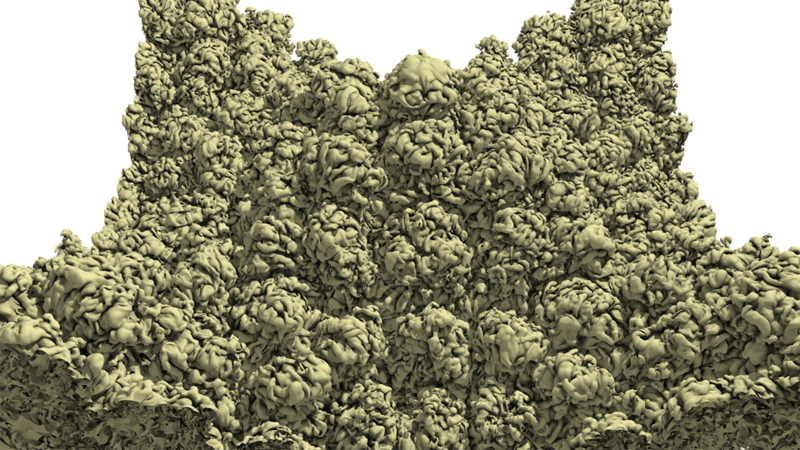
“Dynamic particle system for mesh extraction on the GPU,” In Proceedings of the 5th Annual Workshop on General Purpose Processing with Graphics Processing Units, London, England, GPGPU-5, ACM, New York, NY, USA pp. 38--46. 2012.
ISBN: 978-1-4503-1233-2
DOI: 10.1145/2159430.215943
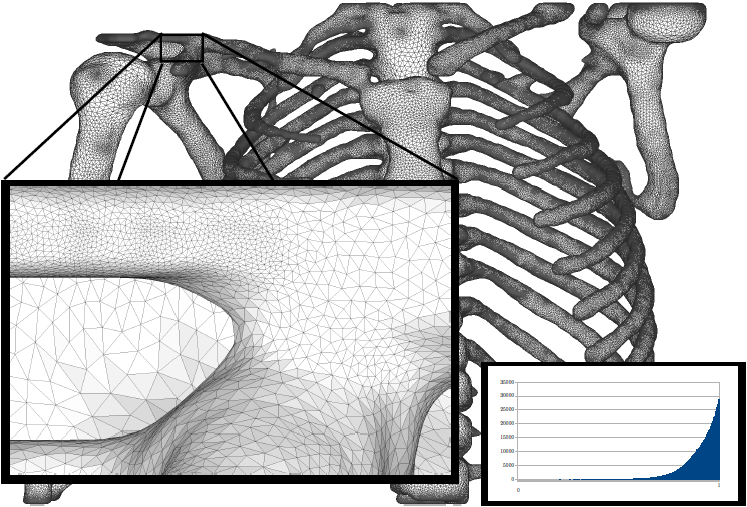
Keywords: CUDA, GPGPU, particle systems, volumetric data mesh extraction
T. Martin, G. Chen, S. Musuvathy, E. Cohen, C.D. Hansen.
“Generalized Swept Mid-structure for Polygonal Models,” In Computer Graphics Forum, Vol. 31, No. 2 part 4, Wiley-Blackwell, pp. 805--814. May, 2012.
DOI: 10.1111/j.1467-8659.2012.03061.x
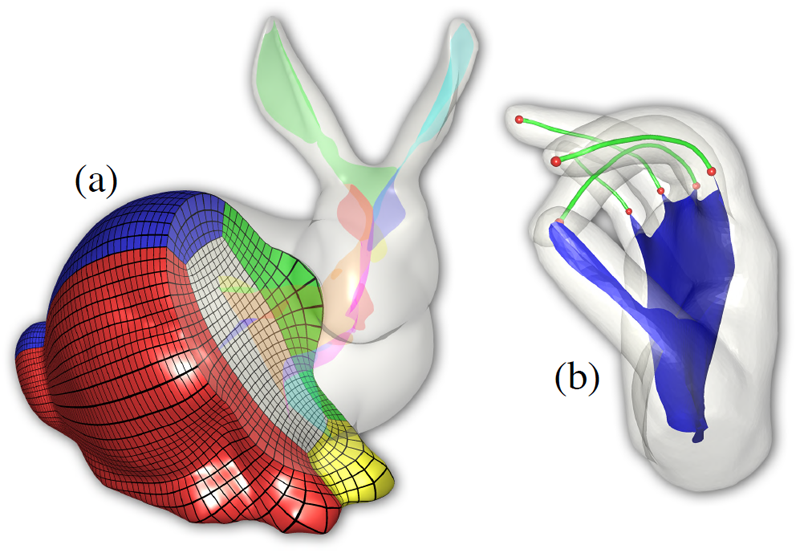
Keywords: scidac, kaust
M. Schott, T. Martin, A.V.P. Grosset, C. Brownlee, Thomas Hollt, B.P. Brown, S.T. Smith, C.D. Hansen.
“Combined Surface and Volumetric Occlusion Shading,” In Proceedings of Pacific Vis 2012, pp. 169--176. 2012.
DOI: 10.1109/PacificVis.2012.6183588
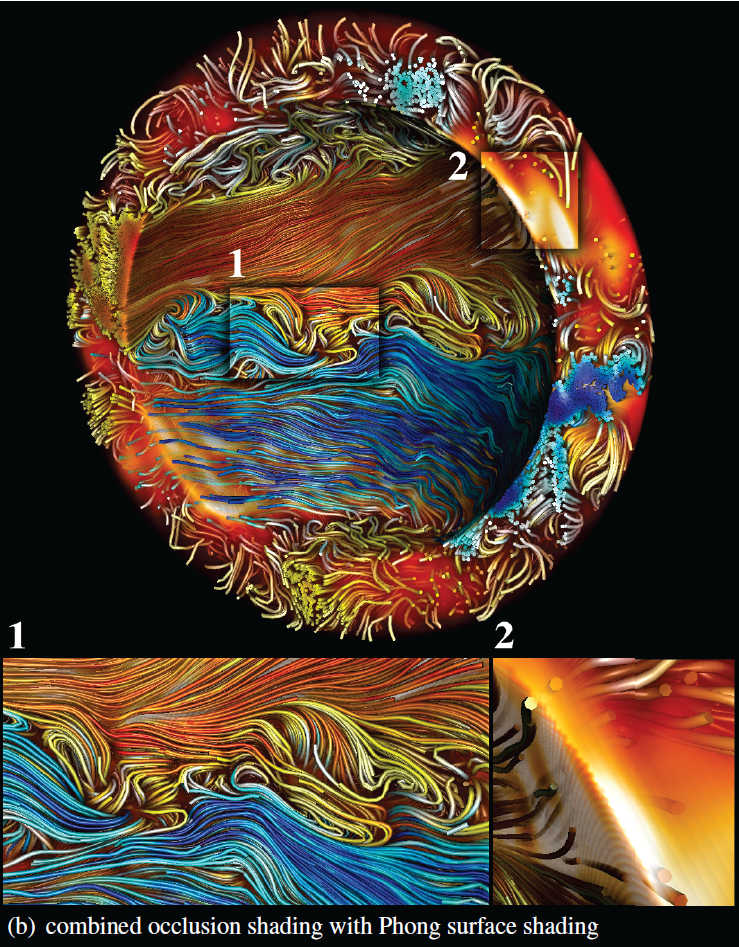
Keywords: scidac, vacet, kaust, nvidia
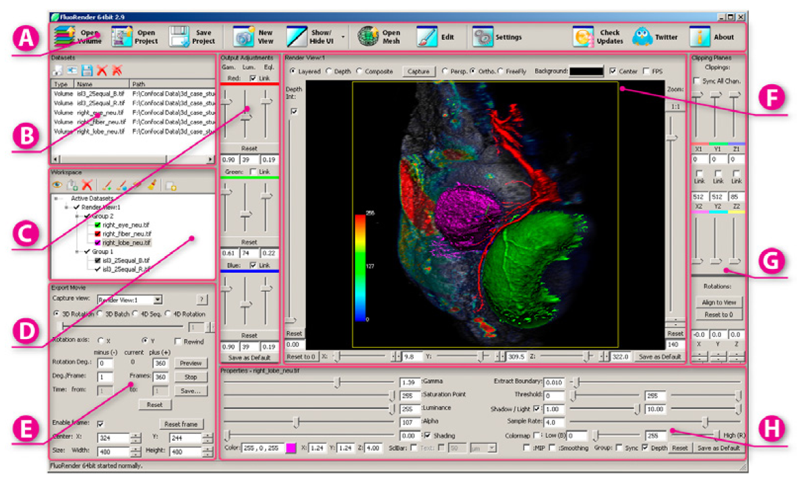
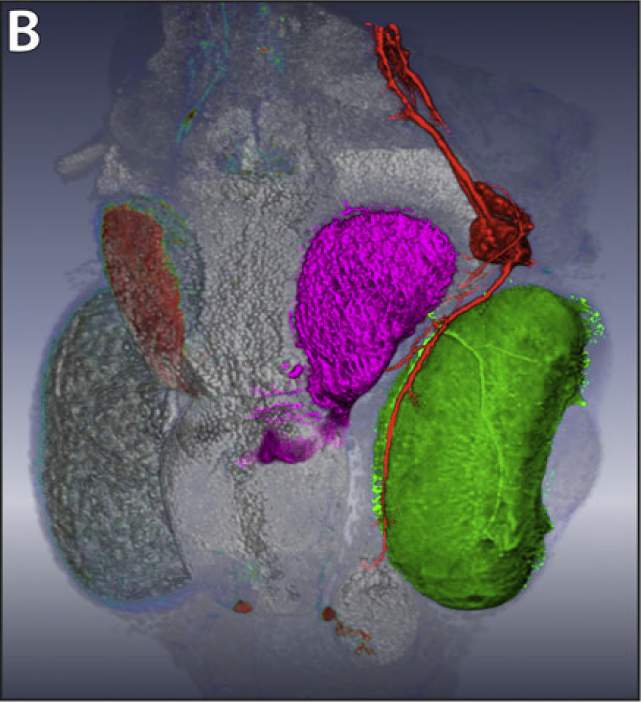
Y. Wan, H. Otsuna, C.-B. Chien, C.D. Hansen.
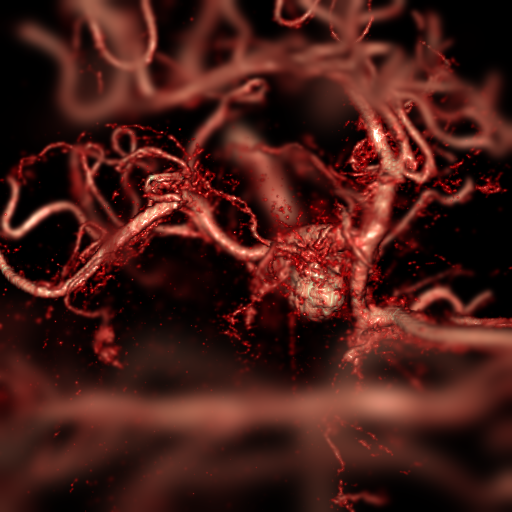
“FluoRender: An Application of 2D Image Space Methods for 3D and 4D Confocal Microscopy Data Visualization in Neurobiology Research,” In Proceedings of Pacific Vis 2012, Incheon, Korea, pp. 201--208. 2012.
DOI: 10.1109/PacificVis.2012.6183592
Keywords: scidac
Y. Wan, H. Otsuna, C.-B. Chien, C.D. Hansen.
“Interactive Extraction of Neural Structures with User-Guided Morphological Diffusion,” In Proceedings of the IEEE Symposium on Biological Data Visualization, pp. 1--8. 2012.
DOI: 10.1109/BioVis.2012.6378577
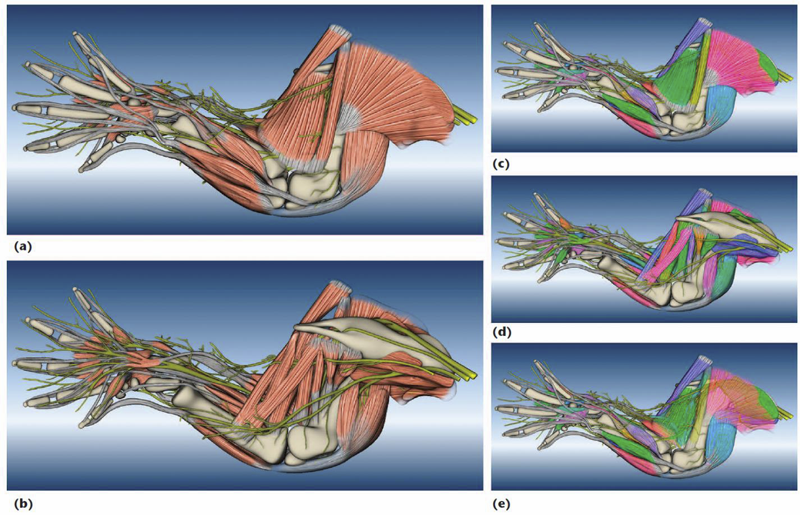
Y. Wan, A.K. Lewis, M. Colasanto, M. van Langeveld, G. Kardon, C.D. Hansen.
“A Practical Workflow for Making Anatomical Atlases in Biological Research,” In IEEE Computer Graphics and Applications, Vol. 32, No. 5, pp. 70--80. 2012.
DOI: 10.1109/MCG.2012.64
An anatomical atlas provides a detailed map for medical and biological studies of anatomy. These atlases are important for understanding normal anatomy and the development and function of structures, and for determining the etiology of congenital abnormalities. Unfortunately, for biologists, generating such atlases is difficult, especially ones with the informative content and aesthetic quality that characterize human anatomy atlases. Building such atlases requires knowledge of the species being studied and experience with an art form that can faithfully record and present this knowledge, both of which require extensive training in considerably different fields. (For some background on anatomical atlases, see the related sidebar.)
With the latest innovations in data acquisition and computing techniques, atlas building has changed dramatically. We can now create atlases from 3D images of biological specimens, allowing for high-quality, faithful representations. Labeling of structures using fluorescently tagged antibodies, confocal 3D scanning of these labeled structures, volume rendering, segmentation, and surface reconstruction techniques all promise solutions to the problem of building atlases.
However, biology researchers still ask, \"Is there a set of tools we can use or a practical workflow we can follow so that we can easily build models from our biological data?\" To help answer this question, computer scientists have developed many algorithms, tools, and program codes. Unfortunately, most of these researchers have tackled only one aspect of the problem or provided solutions to special cases. So, the general question of how to build anatomical atlases remains unanswered.
For a satisfactory answer, biologists need a practical workflow they can easily adapt for different applications. In addition, reliable tools that can fit into the workflow must be readily available. Finally, examples using the workflow and tools to build anatomical atlases would demonstrate these resources' utility for biological research.
To build a mouse limb atlas for studying the development of the limb musculoskeletal system, University of Utah biologists, artists, and computer scientists have designed a generalized workflow for generating anatomical atlases. We adapted it from a CG artist's workflow of building 3D models for animated films and video games. The tools we used to build the atlas were mostly commercial, industry-standard software packages. Having been developed, tested, and employed for industrial use for decades, CG artists' workflow and tools, with certain adaptations, are the most suitable for making high-quality anatomical atlases, especially under strict budgetary and time limits. Biological researchers have been largely unaware of these resources. By describing our experiences in this project, we hope to show biologists how to use these resources to make anatomically accurate, high-quality, and useful anatomical atlases.
L. Zhou, M. Schott, C.D. Hansen.
“Transfer Function Combinations,” In Computers and Graphics, Vol. 36, No. 6, pp. 596--606. October, 2012.
DOI: 10.1016/j.cag.2012.02.007
Keywords: transfer function, volume rendering, classification, user interface, nih, scidac, kaust
2011
C. Brownlee, V. Pegoraro, S. Shankar, P.S. McCormick, C.D. Hansen.
“Physically-Based Interactive Flow Visualization Based on Schlieren and Interferometry Experimental Techniques,” In IEEE Transactions on Visualization and Computer Graphics, Vol. 17, No. 11, pp. 1574--1586. 2011.
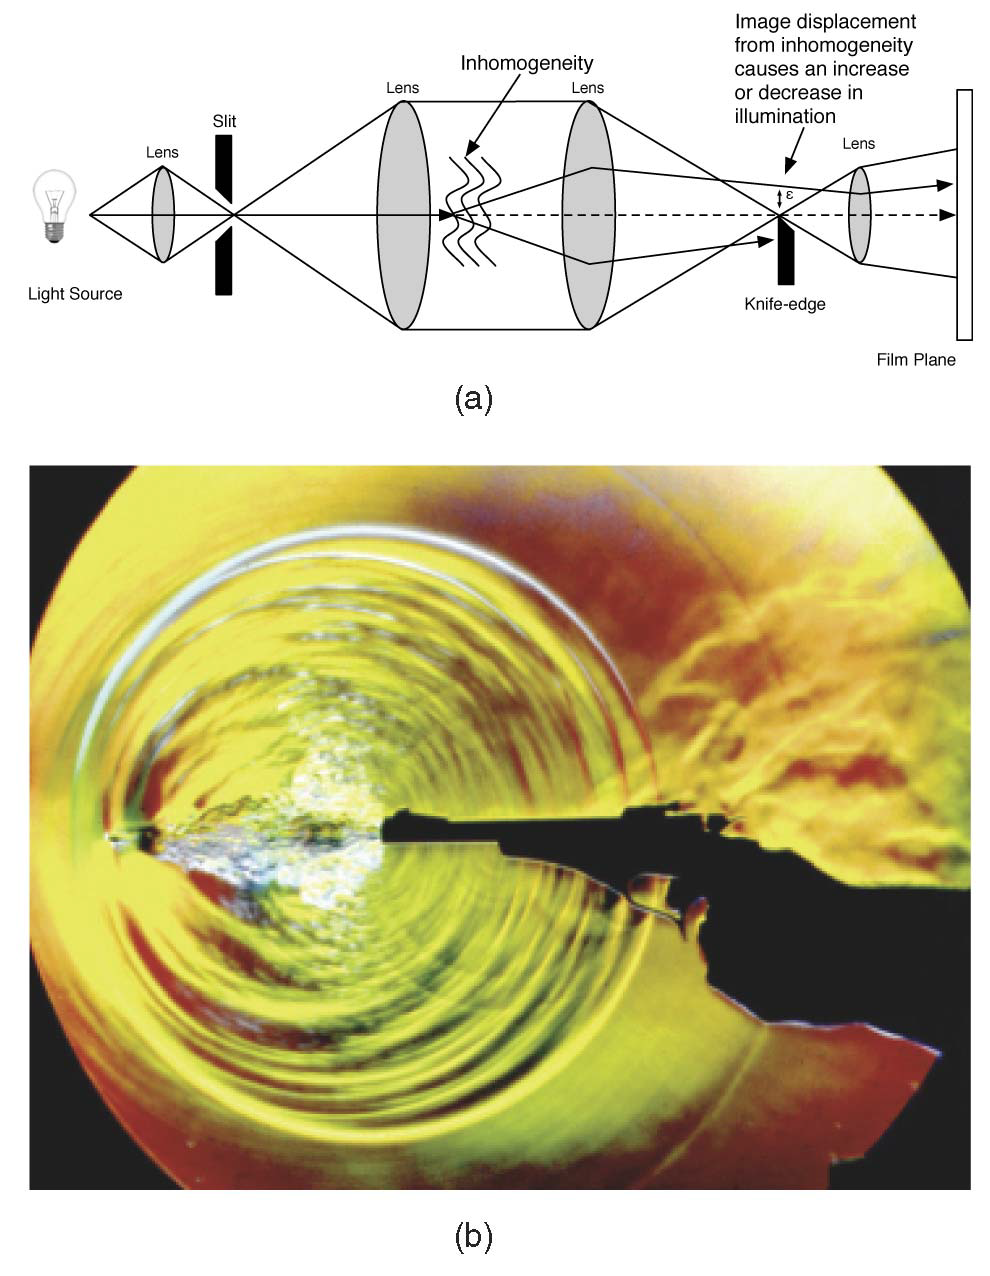
Understanding fluid flow is a difficult problem and of increasing importance as computational fluid dynamics (CFD) produces an abundance of simulation data. Experimental flow analysis has employed techniques such as shadowgraph, interferometry, and schlieren imaging for centuries, which allow empirical observation of inhomogeneous flows. Shadowgraphs provide an intuitive way of looking at small changes in flow dynamics through caustic effects while schlieren cutoffs introduce an intensity gradation for observing large scale directional changes in the flow. Interferometry tracks changes in phase-shift resulting in bands appearing. The combination of these shading effects provides an informative global analysis of overall fluid flow. Computational solutions for these methods have proven too complex until recently due to the fundamental physical interaction of light refracting through the flow field. In this paper, we introduce a novel method to simulate the refraction of light to generate synthetic shadowgraph, schlieren and interferometry images of time-varying scalar fields derived from computational fluid dynamics data. Our method computes physically accurate schlieren and shadowgraph images at interactive rates by utilizing a combination of GPGPU programming, acceleration methods, and data-dependent probabilistic schlieren cutoffs. Applications of our method to multifield data and custom application-dependent color filter creation are explored. Results comparing this method to previous schlieren approximations are finally presented.
Keywords: uintah, c-safe
C. Brownlee, V. Pegoraro, S. Shankar, P.S. McCormick, C.D. Hansen.
“Physically-Based Interactive Flow Visualization Based on Schlieren and Interferometry Experimental Techniques,” In IEEE Transactions on Visualization and Computer Graphics, IEEE Transactions on Visualization and Computer Graphics, Vol. 17, No. 11, IEEE, pp. 1574--1586. November, 2011.
DOI: 10.1109/tvcg.2010.255
T. Ize, C.D. Hansen.
“RTSAH Traversal Order for Occlusion Rays,” In Computer Graphics Forum, Vol. 30, No. 2, Wiley-Blackwell, pp. 297--305. April, 2011.
DOI: 10.1111/j.1467-8659.2011.01861.x
T. Ize, C. Brownlee, C.D. Hansen.
“Real-Time Ray Tracer for Visualizing Massive Models on a Cluster,” In Proceedings of the 2011 Eurographics Symposium on Parallel Graphics and Visualization, pp. 61--69. 2011.
A. Knoll, S. Thelen, I. Wald, C.D. Hansen, H. Hagen, M.E. Papka.
“Full-Resolution Interactive CPU Volume Rendering with Coherent BVH Traversal,” In Proceedings of IEEE Pacific Visualization 2011, pp. 3--10. 2011.
M. Schott, A.V.P. Grosset, T. Martin, V. Pegoraro, S.T. Smith, C.D. Hansen.
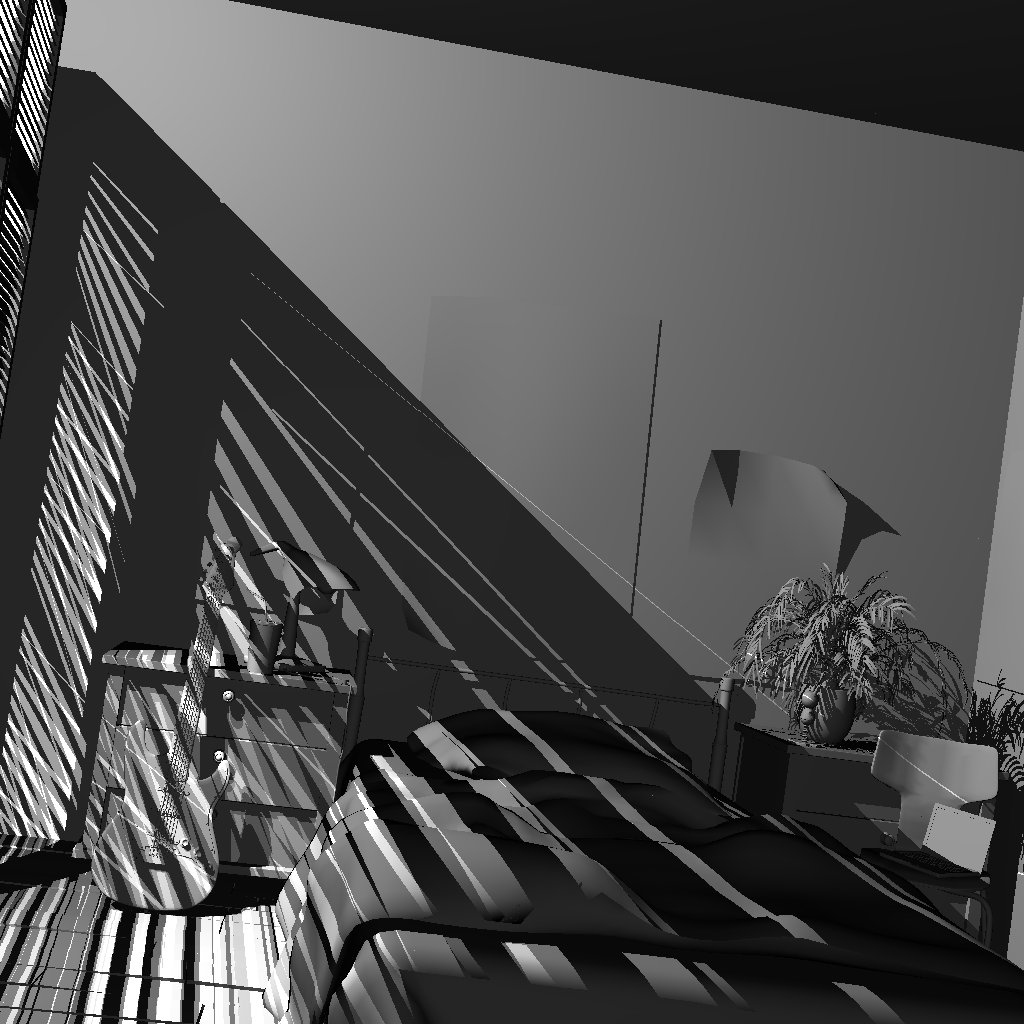
“Depth of Field Effects for Interactive Direct Volume Rendering,” In Computer Graphics Forum, Vol. 30, No. 3, Edited by H. Hauser and H. Pfister and J.J. van Wijk, Wiley-Blackwell, pp. 941--950. jun, 2011.
DOI: 10.1111/j.1467-8659.2011.01943.x
2010
C. Brownlee, V. Pegoraro, S. Shankar, P. McCormick, C.D. Hansen.
“Physically-Based Interactive Schlieren Flow Visualization,” In Proceedings of IEEE Pacific Visualization 2010, Note: Won Best Paper Award!, 2010.
Y. Hijazi, A. Knoll, M. Schott, A. Kensler, C.D. Hansen, H. Hagen.
“CSG Operations of Arbitary Primitives with Interval Arithmetic and Real-Time Ray Casting,” In DROPS - Dagstuhl Research Online Publication Server, In Scientific Visualization: Advanced Concepts, Edited by Hans Hagen, Schloss Dagstuhl - Leibniz-Zentrum fuer Informatik, pp. 78-89. 2010.
M. Schott, P. Grosset, T. Martin, V. Pegoraro, C.D. Hansen.
“Depth of Field Effects for Interactive Direct Volume Rendering,” SCI Technical Report, No. UUSCI-2010-005, SCI Institute, University of Utah, 2010.
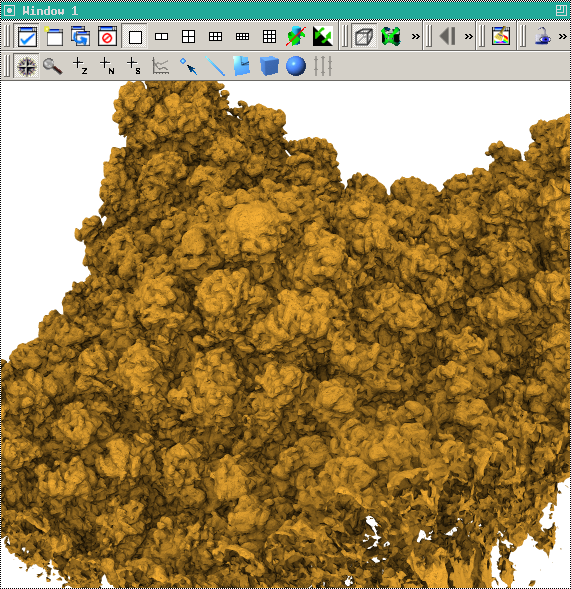
Y. Wan, C.D. Hansen.
“Fast Volumetric Data Exploration with Importance-Based Accumulated Transparency Modulation,” In Proceedings of IEEE/EG International Symposium on Volume Graphics 2010, pp. 61--68. 2010.
DOI: 10.2312/VG/VG10/061-068
Direct volume rendering techniques have been successfully applied to visualizing volumetric datasets across many application domains. Due to the sensitivity of transfer functions and the complexity of fine-tuning transfer functions, direct volume rendering is still not widely used in practice. For fast volumetric data exploration, we propose Importance-Based Accumulated Transparency Modulation which does not rely on transfer function manipulation. This novel rendering algorithm is a generalization and extension of the Maximum Intensity Difference Accumulation technique. By only modifying the accumulated transparency, the resulted volume renderings are essentially high dynamic range. We show that by using several common importance measures, different features of the volumetric datasets can be highlighted. The results can be easily extended to a high-dimensional importance difference space, by mixing the results from an arbitrary number of importance measures with weighting factors, which all control the final output with a monotonic behavior. With Importance-Based Accumulated Transparency Modulation, the end-user can explore a wide variety of volumetric datasets quickly without the burden of manually setting and adjusting a transfer function.
2009
E.W. Bethel, C.R. Johnson, S. Ahern, J. Bell, P.-T. Bremer, H. Childs, E. Cormier-Michel, M. Day, E. Deines, P.T. Fogal, C. Garth, C.G.R. Geddes, H. Hagen, B. Hamann, C.D. Hansen, J. Jacobsen, K.I. Joy, J. Krüger, J. Meredith, P. Messmer, G. Ostrouchov, V. Pascucci, K. Potter, Prabhat, D. Pugmire, O. Rubel, A.R. Sanderson, C.T. Silva, D. Ushizima, G.H. Weber, B. Whitlock, K. Wu.
“Occam's Razor and Petascale Visual Data Analysis,” In Journal of Physics: Conference Series, Journal of Physics: Conference Series, Vol. 180, No. 012084, pp. (published online). 2009.
DOI: 10.1088/1742-6596/180/1/012084
One of the central challenges facing visualization research is how to effectively enable knowledge discovery. An effective approach will likely combine application architectures that are capable of running on today's largest platforms to address the challenges posed by large data with visual data analysis techniques that help find, represent, and effectively convey scientifically interesting features and phenomena.