The Visualization TR&D will develop novel methods and techniques for visualizing structured volumetric data, also sometimes called volumes or 3D images. This will be accomplished through methods that use a data-centric level of detail to minimize or eliminate the need for extensive pre-processing, coupling quantitative methods with the data-centric approach. Such visualization methods will scale with large data sizes and will be based on our demonstrated research and software development expertise where we have experienced the need for reducing or eliminating pre-processing in the current visualization systems we have created: ImageVis3D and FluoRender. By focusing on streaming-based methods that perform level-of-detail computations on demand, we will be able to enhance interactivity. The novel software produced will rely on new techniques for volumetric rendering that accelerate visualization, incorporate data analysis directly in the rendering process, and provide the ability to drill down from summary information to details in the data, thereby enabling biomedical researchers to more quickly and robustly gain understanding of their data. The tools include ImageVis3D Mobile for clinical applications, FluoRender (below) for the visualization and analysis of confocal datasets and μ View for the visualization of uncertainty.
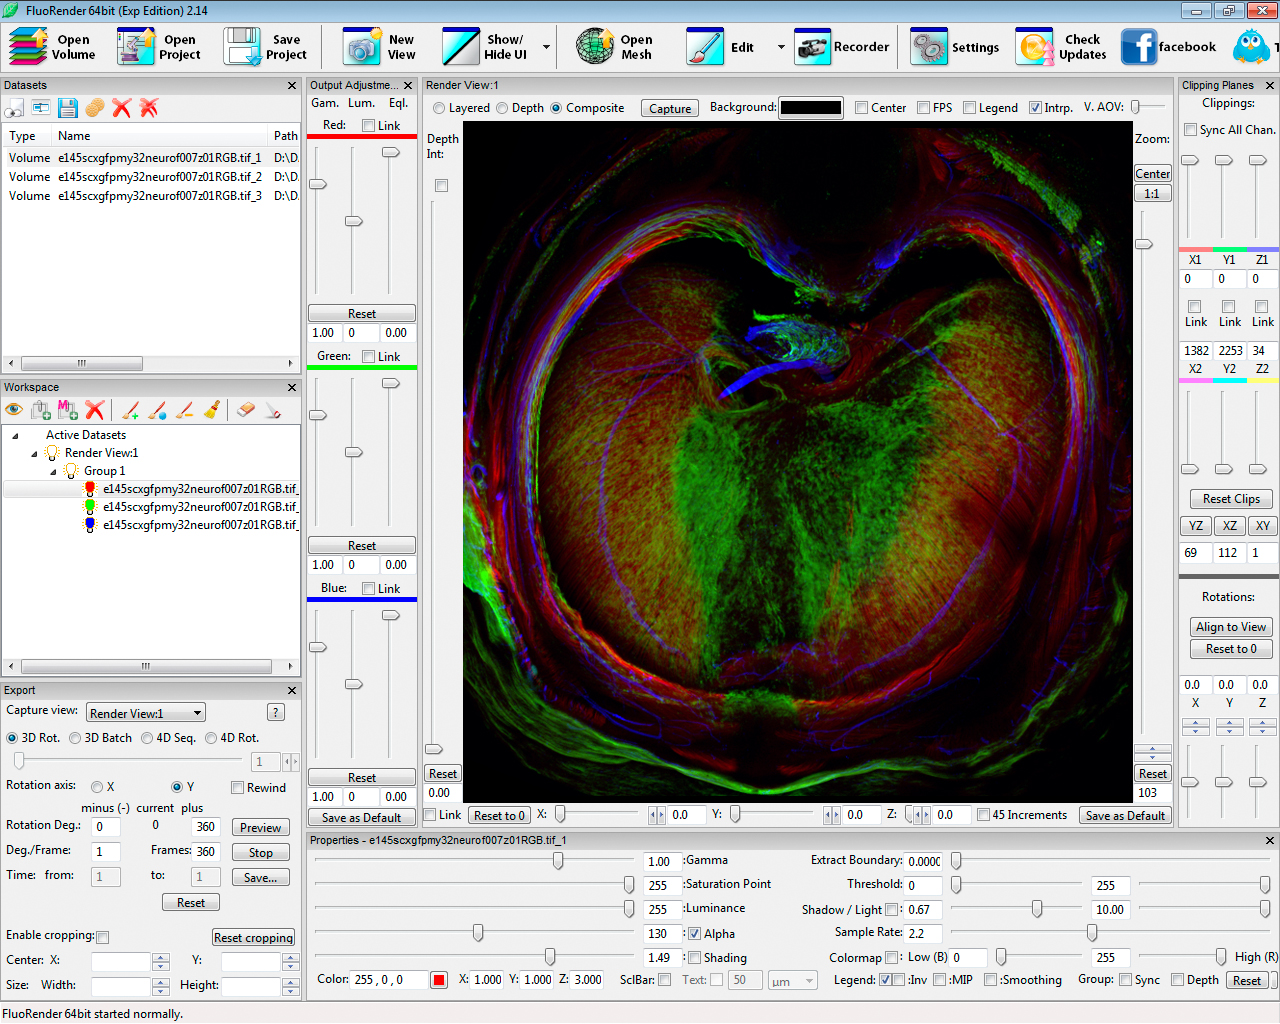
DBP collaborator, Dr. Gabrielle Kardon, uses FluoRender to help discover how developmental innovations led to the evolution of the muscularized mouse diaphragm. In this figure, a 14.5 day mouse embryo diaphragm with muscle (red via immunofluorescent labeling of myosin), tendon (green labeled genetically via GFP), and nerves (blue via immunofluorescent labeling of connective tissue) using the FluoRender visualization system developed by the Investigators.