
 |
Han-Wei ShenProfessor, Computer Science, Ohio State University PhD, Computer Science Dissertation Title: High-Performance Visualization Algorithms for Large-Scale Scientific Data Advisor: Christopher R. Johnson Home Page |
Han-Wei Shen is among the very first SCIers. He began his doctoral work under Prof. Chris Johnson before the institute was even named. He received his BS degree from the Department of Computer Science and Information Engineering at the National Taiwan University in 1988, his MS degree in Computer Science from State University of New York at Stony Brook in 1992 (under Prof. Arie Kaufman), and his PhD in Computer Science from the University of Utah in 1998. He worked at NASA Ames Research Center in California from 1996 to 1999, where he was a research scientist in NASA's Advanced Supercomputing Division (NSA). Dr. Shen is currently a full professor in the Department of Computer Science and Engineering at the Ohio State University. He is also the head of the Graphics and Visualization Study (GRAVITY) research group. So far twelve PhDs and many master's students have graduated from the GRAVITY research group under his advising.
Professor Shen's research focus is primarily on scientific visualization and computer graphics. For the past two decades, he has been tackling several fundamental problems in the core area of scientific visualization. His best known works include acceleration of isosurface extraction, steady and unsteady flow visualization techniques, algorithms and data structures for the analysis and visualization of time-varying multivariate data sets, information visualization, and efficient parallel visualization algorithms. More recently he has pioneered work in developing an information-theoretical framework for quality assessment, management, and visualization of data generated from extreme-scale scientific simulations.
Professor Shen is a winner of the National Science Foundation's CAREER award and the US Department of Energy's Early Career Principal Investigator Award. He also won the Outstanding Teaching Award twice in the Department of Computer Science and Engineering at the Ohio State University. He was an associate editor for IEEE Transactions on Visualization and Computer Graphics, a paper chair for IEEE Pacific Visualization 2009 and 2010, and currently serves as a paper chair for IEEE SciVis 2013, one of the main conferences under IEEE Visualization 2013. He has directed many federally funded research projects by DoE, NSF, NIH, and NASA. He continues to collaborate with many faculty members in the SCI institute, including Prof. Chris Johnson, Prof. Chuck Hansen, and Prof. Valerio Pascucci.
 |
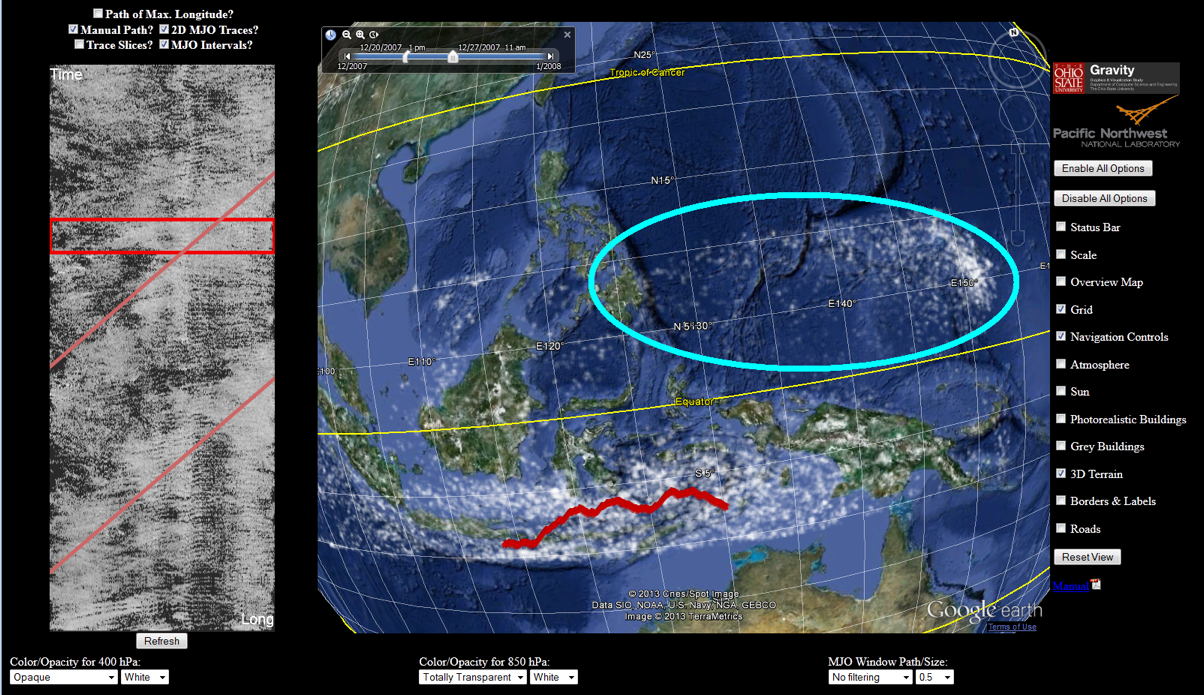 |
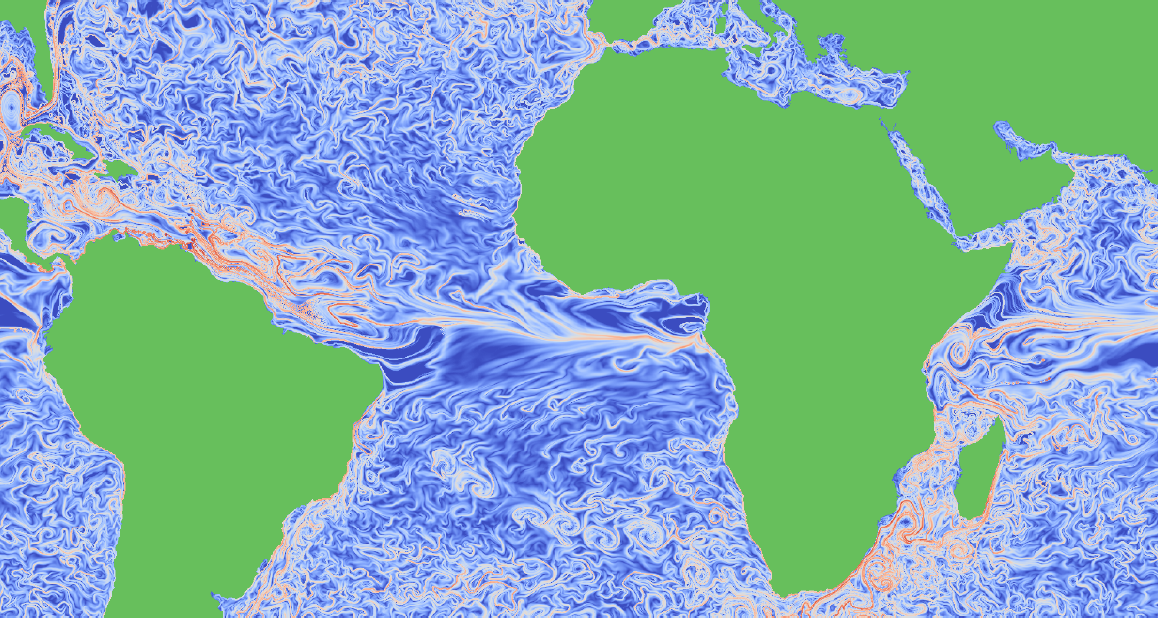
| Prof. Shen and his students developed a scalable FTLE computation algorithm using a pipelining model. In the algorithm, they break the compute processes into different time groups, where each group independently processes different time interval. Particles are passed between different time groups as they travel in space and time to achieve computation efficiency and reduce I/O overhead. The algorithm is able to demonstrate strong scaling up to 16K processors. | The Madden-Julian oscillation (MJO) plays a significant role in intraseasonal weather variations over the Indian and Pacific Oceans. Prof. Shen and his students developed an integrated analysis and visualization tool for simulated MJO episodes. Using a Web-based interface, the tool lets scientists more easily identify cloud and environmental processes associated with the MJO. By combining domain-knowledge-assisted feature tracking and global data overviews in both space and time, the tool enables climatologists to analyze their data more effectively. |