Abstract
Rankings are a popular and universal approach to structuring otherwise unorganized collections of items by computing a rank for each item based on the value of one or more of its attributes. This allows us, for example, to prioritize tasks or to evaluate the performance of products relative to each other. While the visualization of a ranking itself is straightforward, its interpretation is not, because the rank of an item represents only a summary of a potentially complicated relationship between its attributes and those of the other items. It is also common that alternative rankings exist which need to be compared and analyzed to gain insight into how multiple heterogeneous attributes affect the rankings. Advanced visual exploration tools are needed to make this process efficient. In this paper we present a comprehensive analysis of requirements for the visualization of multi-attribute rankings. Based on these considerations, we propose LineUp - a novel and scalable visualization technique that uses bar charts. This interactive technique supports the ranking of items based on multiple heterogeneous attributes with different scales and semantics. It enables users to interactively combine attributes and flexibly refine parameters to explore the effect of changes in the attribute combination. This process can be employed to derive actionable insights as to which attributes of an item need to be modified in order for its rank to change. Additionally, through integration of slope graphs, LineUp can also be used to compare multiple alternative rankings on the same set of items, for example, over time or across different attribute combinations. We evaluate the effectiveness of the proposed multi-attribute visualization technique in a qualitative study. The study shows that users are able to successfully solve complex ranking tasks in a short period of time.
Citation
Samuel Gratzl,
Alexander Lex,
Nils Gehlenborg,
Hanspeter Pfister,
Marc Streit
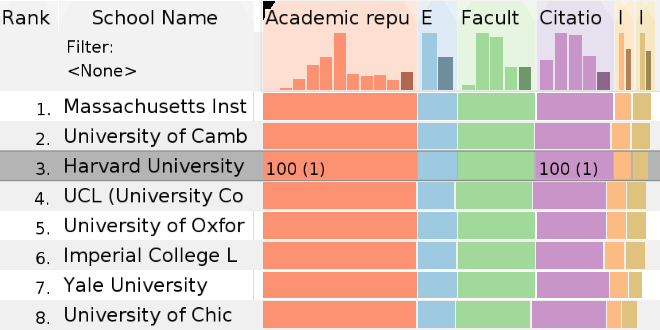
LineUp: Visual Analysis of Multi-Attribute Rankings
IEEE Transactions on Visualization and Computer Graphics (InfoVis '13), 19(12), pp. 2277–2286, doi:10.1109/TVCG.2013.173,
2013.
IEEE InfoVis 2013 Best Paper Award
Demo Data Sets
In the examples and demos we have used three datasets:
- Times Higher Education 100 Under 50 University Ranking
- QS World University Ranking
- USDA National Nutrient Database
Related Work
Ranking Visualization Techniques
- N. Andrienko and G. Andrienko. Informed Spatial Decisions Through Coordinated Views. Information Visualization, 2(4):270-285, 2003
- J. Bautista and G. Carenini. An integrated task-based framework for the design and evaluation of visualizations to support preferential choice. Proceedings of the Conference on Advanced Visual Interfaces (AVI ‘04), 150–157, 2006.
- M. Behrisch, J. Davey, S. Simon, T. Schreck, D. Keim, and J. Kohlhammer. Visual comparison of orderings and rankings. In Proceedings of the EuroVis Workshop on Visual Analytics (EuroVA ‘13), 2013.
- G. Carenini and J. Lloyd. ValueCharts: analyzing linear models expressing preferences and evaluations. Proceedings of the Conference on Advanced Visual Interfaces (AVI ‘04), 150–157, 2006.
- S. J. Fernstad, J. Shaw, and J. Johansson. Quality-based guidance for exploratory dimensionality reduction. Information Visualization, 12(1):44-64, 2013.
- P. Kidwell, G. Lebanon, and W. S. Cleveland. Visualizing incomplete and partially ranked data. IEEE Transactions on Visualization and Computer Graphics, 14(6):1356-1363, 2008.
- A. P. Sawant and C. G. Healey. Visualizing multidimensional query results using animation. In Electronic Imaging 2008, page 680904, 2008.
- J. Seo and B. Shneiderman. A rank-by-feature framework for interactive exploration of multidimensional data. Information Visualization, 4(2):96-113, 2005.
- C. Shi, W. Cui, S. Liu, P. Xu, W. Chen, and H. Qu. RankExplorer: visualization of ranking changes in large time series data. IEEE Transactions on Visualization and Computer Graphics, 18(12):2669-2678, 2012.
Basic Techniques
- W. C. Brinton. Graphic presentation. Brinton Associates, 1939.
- S. Few. Show Me the Numbers: Designing Tables and Graphs to Enlighten. Analytics Press, 2nd edition, 2012.
- J. Heer and G. G. Robertson. Animated transitions in statistical data graphics. IEEE Transactions on Visualization and * Computer Graphics (InfoVis ‘07), 13(6):1240-1247, 2007.
- M. John, C. Tominski, and H. Schumann. Visual and analytical extensions for the table lens. In Proceedings of the SPIE Conference on Visualization and Data Analysis (VDA ‘08), 2008.
- A. Inselberg. The plane with parallel coordinates. The Visual Computer, 1(4):69-91, 1985.
- J. Mackinlay. Automating the design of graphical presentations of relational information. ACM Transactions on Graphics, 5(2):110-141, 1986.
- T. Munzner, F. Guimbretière, S. Tasiran, L. Zhang, and Y. Zhou. TreeJuxtaposer: scalable tree comparison using Focus+Context with guaranteed visibility. In Proceedings of the ACM Conference on Computer Graphics and Interactive Techniques (SIGGRAPH ‘03), pages 453-462. ACM Press, 2003.
- C. Park. Edward Tufte’s “Slopegraphs”, 2011.
- C. Park. A slopegraph update, 2011.
- R. Rao and S. K. Card. The table lens: merging graphical and symbolic representations in an interactive focus + context visualization for tabular information. In Proceedings of the SIGCHI Conference on Human Factors in Computing Systems (CHI ‘94), pages 318-322. ACM Press, 1994.
- N. B. Robbins and R. M. Heiberger. Plotting Likert and other rating scales. In Proceedings of the 2011 Joint Statistical Meeting, 2011.
- E. Tufte. The Visual Display of Quantitative Information. Graphics Press, 2nd edition, 1983.
- E. Tufte. Envisioning information. Graphics Press, Cheshire Conn., 5th edition, 1995.
- M. Ward, G. Grinstein, and D. A. Keim. Interactive Data Visualization: Foundations, Techniques, and Application. A.K. Peters, 2010.
Acknowledgements
We wish to thank Blake T. Walsh, Günter Öller and the anonymous paper reviewers for their input.
This work was supported in part by the Austrian Research Promotion Agency (840232), the Austrian Science Fund (J3437-N15), the Air Force Research Laboratory and DARPA grant FA8750-12-C-0300, and the United States National Cancer Institute (U24CA143867).