Exploration of Complex Dataset Relationships for Drug Discovery
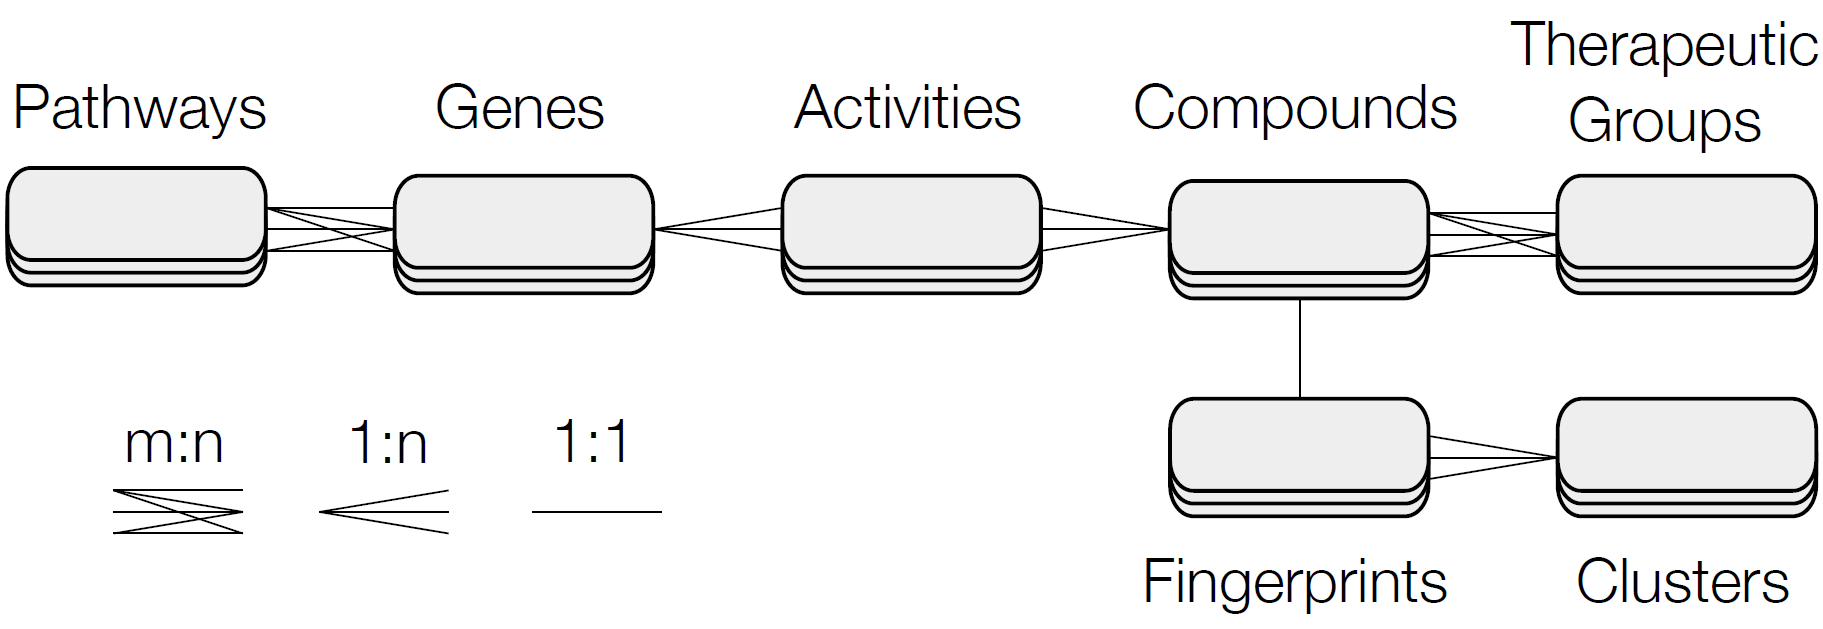
In drug discovery, the analysis of multiple heterogeneous datasets is an integral part to evaluate effective yet safe compounds. ConTour is a visual analysis technique that allows analysts to effectively explore complex relationships between datasets. The figure below gives an overview of an exemplary setup of datasets that can be analyzed with ConTour.
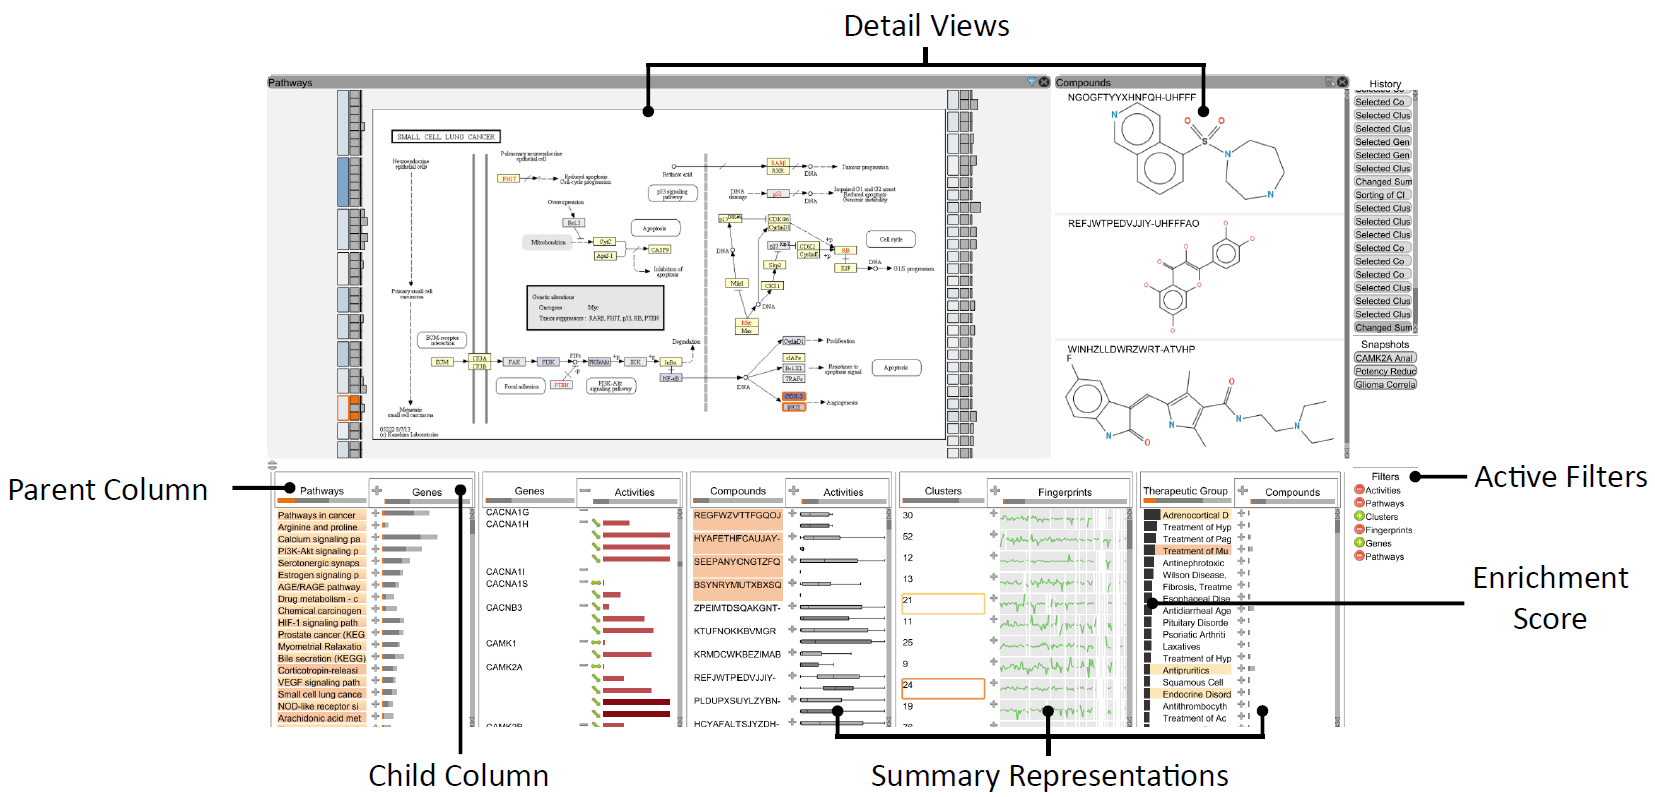
The main visual interface of ConTour is simple yet effective. It displays the items of each dataset in a column. The way items are presented is tailored to the item type. For example, bar charts are used for biological fingerprints of compounds, which consist of many numerical attributes. The relationships between items of different columns are revealed through interaction: Selecting one or multiple items in one column brings all related items of other columns to the top and highlights them. Another possibility to reveal item relationships between columns is nesting. By putting one column into an other column, the child column lists all related items for each item in the parent column. To save space, the child items of each parent item can be collapsed into summary representations.
ConTour provides different ways to filter the data. Selection-based filters reduce the items in all columns to those that are related to the currently selected items. Attribute-based filters remove all items of a column whose attributes do not satisfy a certain filter criterion, like, for example, a value range for numerical attributes.
To quickly find the most interesting items, the items of a column can be sorted by some attribute, or ranked according to a parametrizable enrichment score. This score conveys how specific two items of different columns are related via the items of a third column. It can be used, for example, to identify fingerprint clusters that show an enrichment in compounds that modulate a specific pathway.
Finally, ConTour provides a number of detail views tailored to the different item types. For example, the detail view for compounds displays the chemical structure of multiple compounds. The pathway detail view shows one pathway graph with all of its contained genes and also indicates compounds that map to this pathway and associated fingerprint clusters.