Burn Rate Validation Study
About
A good burn model needs to be validated against both temperature and pressure dependent data for burn rate (normal to surface).
Two good sources for burn rates are available, however Alice Atwood's data [1] provides the most comprehensive. Simulations
were run at three of the five temperatures from the paper, and over the entire pressure range reported there. The simulation was
allowed to come to a steady burning state before the burn rate was measured.
The typical Burn rate vs. time plot looks like:
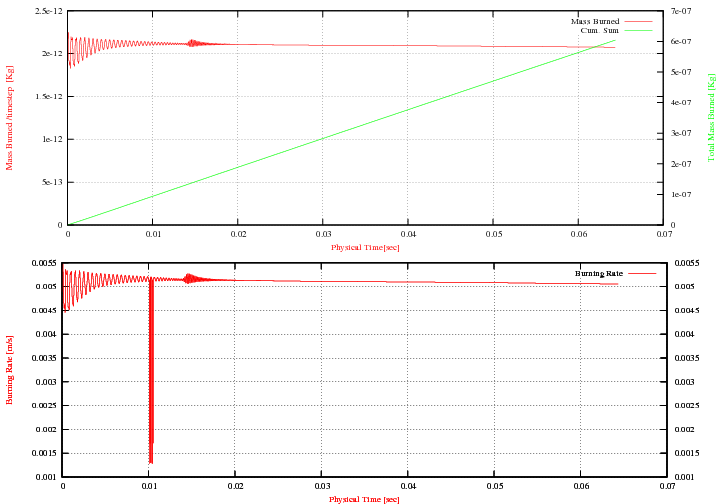
where the top plot shows the mass burned per timetep and the bottom plot shows burning rate (mass burned/surface area).
Results
Input File
Figure 1: Burning rates from Atwood's Paper organized based on pressure:
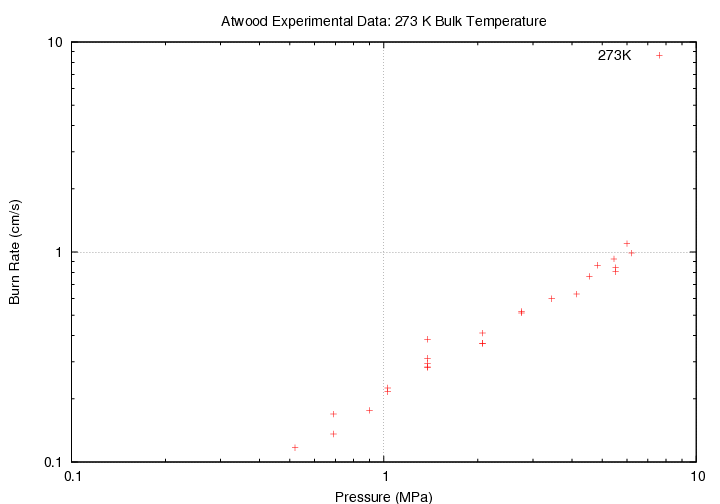
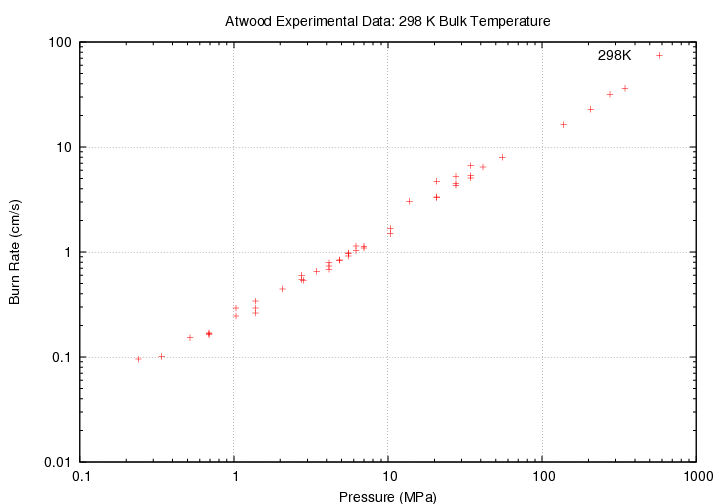
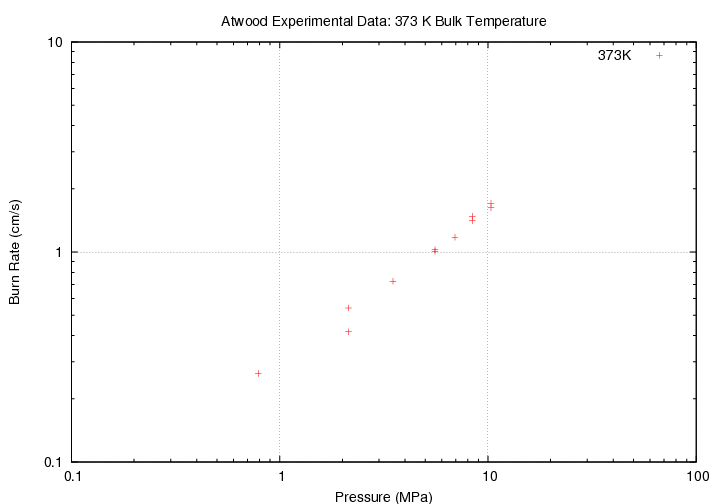
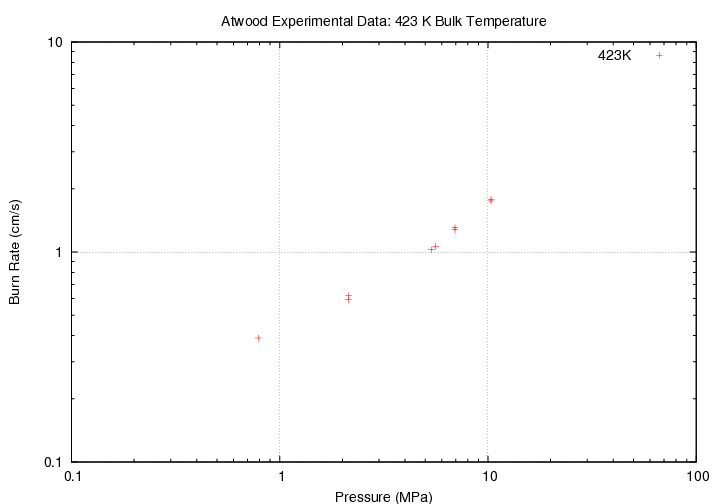
Figure 2: Comparison between Atwood and Simulated Burn rates at three tempeartures, versus pressure:
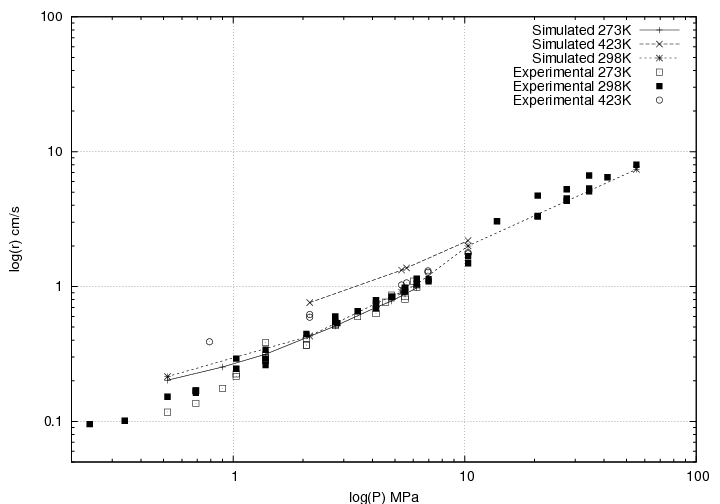
Figure 3: Comparison between Atwood and Simulated Burn rates at several pressures, versus temperature:
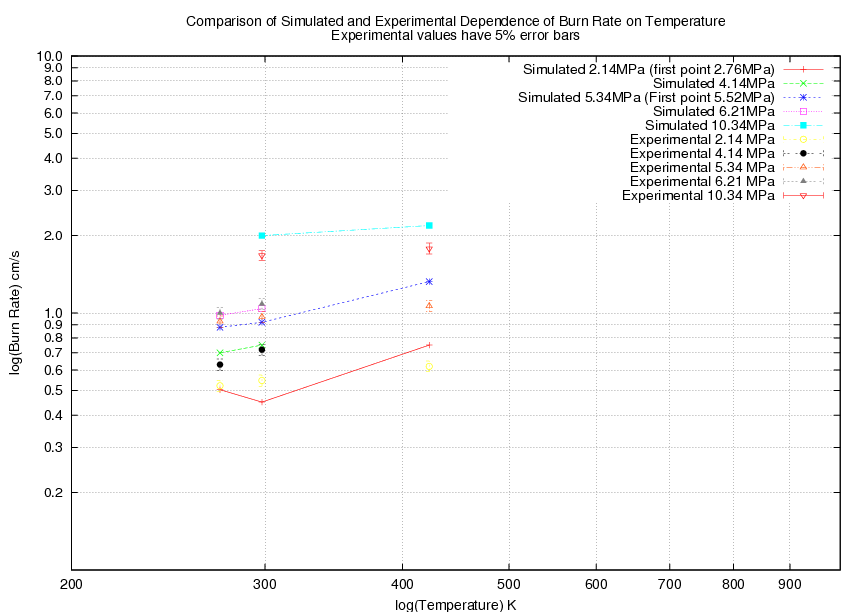
Figure 4: Convergence
Conclusion
From these plots, several important conclusions must be drawn. In general Atwood's data has little scatter about the f(P)=A*P^n line
that can be drawn as a trend through the data. An estimate of 5% experimental error is assumed in her paper [1]. When comparing simulation
data to that Atwood measured, good agreement can be seen in intermediate pressures. Fig. 2 shows comparison of all pressure data for the three
temperatures chosen as validation temperatures. In general, the 273K data lies only slighly lower than the 298K and the 423K curve lies close
the data above 298K. However, we can see that burning rates are overestimated at low pressures (greater than 1MPa). This will affect early
rate data for DDT simulations. However, in unconfined situations, the measured rate is not large enough to erroneously cause detonation.
Fig. 3 also shows that at really high pressures, and high temperatures our burning model overestimates the rate of reaction. Never is this
effect larger than a factor of 2 larger. In fact, the majority of the moderate pressure data lies within the 5% experimental error. When
taking into account errors in the measured pressure and rate in teh simulation, (5-7%) all points but the 298K/2.14 MPa lie within uncertainty.
In general, we have good agreement that should be useful in qualitatively measuring DDT in confined situations, and thermal cookoff experiments.
References
1. Atwood, A.I., Boggs. T.L., Curran, P.O., Parr, T.P., Hanson-Parr, D.M., Price, C.F., Wiknich, J. Burn Rate of PBX9501 at Various Temperatures and Pressures. J. Prop. Pow. 1999, 15, pp. 740-747.
DDT Validation Home
Home
Contact: josuf dot the dot uf at gmail