Lab 6: Control of Respiration
Dafang Wang
1. Introduction
This experiment investigated key features of respiration and mechanisms controlling respiration. The experiment includes measuring ventilation volumes, exploring respiration rates and depth, understanding physical models for the fillings of alveolar and lungs, and most importantly the role of oxygen and carbon dioxide in the control of respiration.
The main function of the respiratory system is exchange of gases between the human body and the external atmosphere. Gas exchange takes place at the alveoli in lungs, where oxygen and carbon dioxide diffuses between alveoli and capillaries following pressure gradients. Ventilation, the movement of air between the atmosphere and the lungs, is governed by skeletal muscles in thorax. The inspiration depends on the contraction of inspiratory muscles and diaphragm. The expiration includes two types: the passive expiration during quiet breathing is caused by the elastic recoil of diaphragm, and the active expiration that occur during exercise or voluntary exhalation is caused by the contraction of expiratory muscles.
Although skeletal muscles provide the dynamics of the respiratory system, they do not administer the rhythmic breathing process. Skeletal muscles, unlike cardiac muscles, do not contract spontaneously but instead are initiated by somatic neurons which the central nervous system controls. Carbon dioxide is the primary factor to administer the ventilation by influencing the nervous system. Oxygen and plasma PH have minor effects, applied in similar ways.
In this experiment, we first explored the physical aspects of the respiratory, focusing a few physical factors reflecting ventilation activities and outputs. Then we studied the controlling effects of oxygen and carbon dioxide by investigating those physical factors.
2. Methods
2.1 Measuring Ventilation Volume by Spirometer
In order to obtain the quantitative relation between the air volume and its corresponding spirometer readings, we repeatdly injected a fixed volume of air and noted down the reading. The recorded data are summarized in Table 1, and Figure 1 presents the calibration and the formula for converting spirometer readings to corresponding air volumes.
Table 1: Calibration Data
|
Spirometer Reading |
0 |
0.34685 |
0.74255 |
1.2213 |
2.71617 |
|
Volume (Liter) |
0 |
0.5 |
1 |
1.5 |
3 |
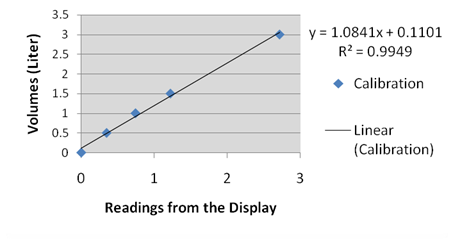
Figure 1. Calibration Data
2.2 Respiration Rates and Depth
Three parameters were measured in this test: the heart rate, the saturation pressure of oxygen, and the respiration rate. At first, the subject was measured at rest. Then the subject walked briskly for five minutes and measurements were taken once he returned.
After the subject recovered to resting state, we made him breathe through a tube for two minutes. Measurements were taken immediately after he finished.
2.3 Breath holding
This test measured the same factors as the last test. Measurements were taken in three occasions: (1)the subject held breath after normal inhalation, (2)after moderately deeper inhalation, and (3)after a deep inhalation after exercise.
2.4 Alveolar Filling
Two rubber balloons were taken to simulate the left and right lung. Initially, each balloon was isolated from the other and filled with different volume of air. Then the pathway connecting both balloons was open and the volume change of each balloon was observed.
2.5 Lung Model
The physical mechanism of lungs is modeled by two balloons placed in a plastic container. First, with the container sealed, we pulled down the membrane at the bottom of the container (simulating the diaphragm) and observed the response of balloons. Then, we repeated this test with container being open.
2.6 Re-breathing and Respiration Control
The purpose of re-breathing test is to evaluate the roles of oxygen and carbon dioxide in respiratory controls. In this experiment, the same procedure was repeated twice, each time with slightly different conditions. The subject breathed within a spirometer that is a closed system such that the air breathed in an out was isolated from the external atmosphere. In the first test, “re-breathing room air”, the spirometer was filled with room air. In the second test, “re-breathing oxygen-rich air”, the spirometer was filled with rich oxygen.
3. Results
3.1 Measuring Ventilation Volume by Spirometry
After putting on the spirometer mouthpiece, the subject breathed quietly for five normal breathes, then took an inspiration as deep as possible, followed by one expiration as deep and rapidly as possible. The lung volume during this period, recorded by the spirometer, is shown in Figure 2. The respiratory parameters of our interest are presented in Table 2.
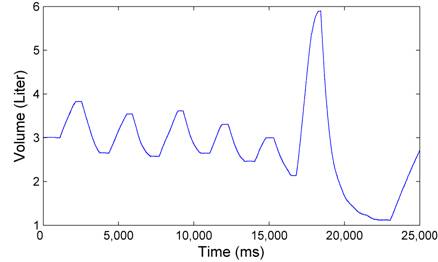
Figure 2. Spirometer tracing of five normal breaths followed by a deep inspiration and a rapid expiration.
Table 2. Respiratory Volumes Obtained in the Volume Test shown in Figure 2.
|
Tidal Volume (TV) |
Inspiratory reserve volume (IRV) |
Inspiration capacity (IC) |
Vital Capacity (VC) |
Forced Expiratory Volume (FEV1) |
|
1.19 L |
2.07 L |
3.78 L |
4.79 L |
3.68 L |
The forced expiratory volume (FEV1) is also measured by a clinical system named AccuTrax. In this test, the subject took a deep breath and exhale hard and rapidly through the device. The volume tracing recorded by the device is shown in Figure 3. The FEV1 was measured to be 3.63 liters.
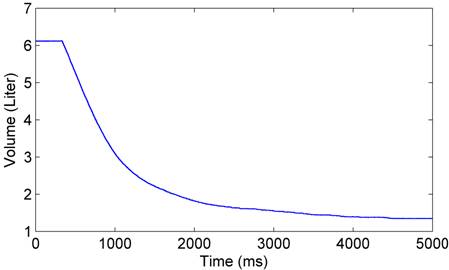
Figure 3. The lung volume recorded by the device AccuTrax.
3.2 Respiration rates and Depth
Table 3 presents the data measured before and after the subject took the exercise by walking briskly for five minutes. Table 4 presents the data for our exploration on the dead space.
Table 3. Data measured before and after exercise.
|
|
At rest |
After Exercise |
|
Heart Rate |
65 |
74 |
|
S pO2 |
98 |
96 |
|
Breathes per Minute |
17 |
18 |
Table 4. Data measured before and after the subject breathed through a tude.
|
|
At rest |
After test |
|
Heart Rate |
61 |
58 |
|
S pO2 |
98 |
93 |
|
Breathes per Minute |
16 |
20 |
3.3 Breath holding
Measurements were taken in three occations: at rest, after hyperventilation and after exercise. The collected data are presented by Table 5.
3.4 Alveolar Filling
After the pathway between the two balloons was open, the air moved from the small balloon to the large balloon. Finally, one balloon contained most air whereas the other was nearly empty.
Table 5. The data collected in the breath holding test.
|
|
Breath holding at rest |
Breath holding after hyperventilatoin |
Breath holding after exercise |
|||
|
|
Begin |
End |
Begin |
End |
Begin |
End |
|
Heart Rate |
66 |
58 |
66 |
67 |
154 |
147 |
|
S pO2 |
98 |
94 |
98 |
99 |
98 |
98 |
|
Breathes per Minute |
128 sec |
142 sec |
30 sec |
|||
3.5 Lung Model
When the container simulating the chest was sealed, pulling down the membrane at the bottom inflated the balloons rapidly. The inflated balloon then shrank gradually. When the container was open, pulling down the membrane only inflated the balloons a little, and the balloons shrank much more rapidly.
3.6 Re-breathing and Respiration Control
3.6.1 Re-breathing room air
The experiment lasted for about 6 minutes. At the end of the test, the subject felt uncomfortable, but did not feel warm. His face flushed and his lips turned blue. He felt compelled to breathe more rapidly, but not deeper. Meanwhile, the respiratory signals were observed to increase their amplitude.
Measurements were taken every 30 seconds. Factors that we monitored include inspired/expired oxygen concentration and dioxide concentration, the respiration rate, the oxygen saturation, and heart rate. Figure 4 presents the concentration of oxygen and carbon dioxide measured during inspiration and expiration, respectively. Figure 5 shows the heart rate, respiration rate and oxygen saturation measured in the test. Figure 6 illustrates the subject’s respiration volume throughout this test.
3.6.2 Re-breathing Oxygen-Rich Air
This test lasted about 6 minutes, too. Immediately after the test, the subject reported to have breathed much harder and deeper. He felt somewhat lightheaded, his eyes becoming fuzzy with deteriorated vision. He also felt warmer in the body. However, he did not sense change in the heart rate.
Figure 7 illustrates the concentration of oxygen and carbon dioxide measured during inspiration and expiration, respectively. The corresponding respiration rate, heart rate and oxygen saturation were demonstrated in Figure 8. The respiration volume recorded by the spirometer during this test was shown in Figure 9.
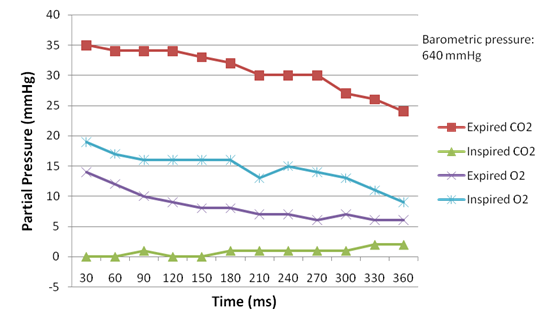
Figure 4. Concentration of oxygen and carbon dioxide measured in re-breathing room air.
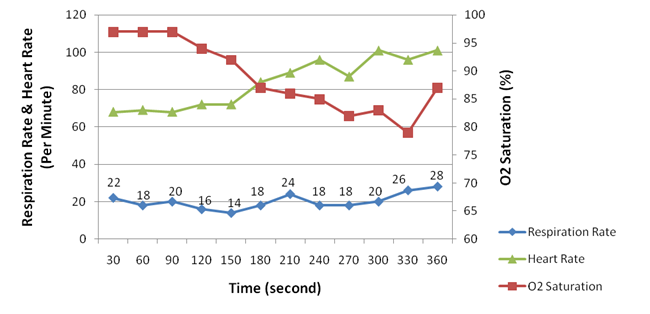
Figure 5. Heart rate, respiration rate and oxygen saturation measured in re-breathing room air.
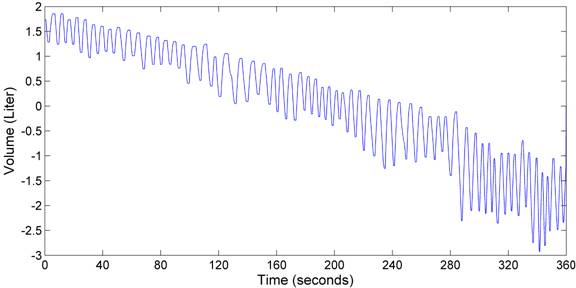
Figure 6. Respiration volume recorded by the spirometer when the subject re-breathed room air.
4. Discussions
4.1 Measuring Ventilation Volume by Spirometer
Forced Expiratory Volume in 1 Second (FEV1), along with Forced Vital Capacity (FVC), is the primary indicator of lung functions, used for diagnosis of lung diseases such as asthma, pulmonary fibrosis, cystic fibrosis, and COPD. The FEV1 measured in this test was 3,680mL, as compared to the FVC of 4,790mL. The ratio of FEV1 to FVC was 76.8%. Given that this ratio is known to be approximately 75%-80% in healthy adults, it could be inferred that the subject was healthy lungs.
4.2 Respiration Rates and Depth
When the subject breathed the room air directly, exercise increased the heart rate (from 65 BPM to 74 BPM) and the breathing rate (from 17 per minute to 18 per minute), while lowering the oxygen saturation (from 98% to 96%). Such observation was in agreement with our knowledge that exercise accelerates the oxygen consumption by cells and thereby requires cardiac output to increase.
When the subject breathed through a tube, a larger increase in breath rate before and after exercise was observed (from 16 times to 20 times per minute). However, the heart rate dropped after exercise from 61 BPM to 58 BPM, showing an opposite trend to the situation when the subject breathed room air.

Figure 7. Concentration of oxygen and carbon dioxide measured in re-breathing rich oxygen.
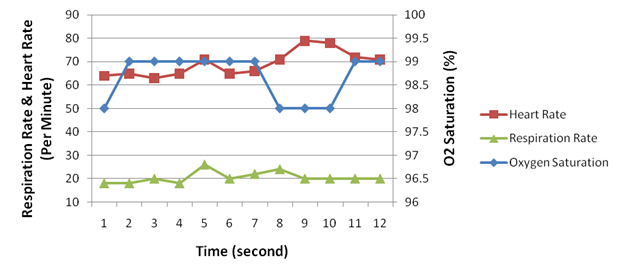
Figure 8. Heart rate, respiration rate and oxygen saturation measured in re-breathing oxygen-rich air.
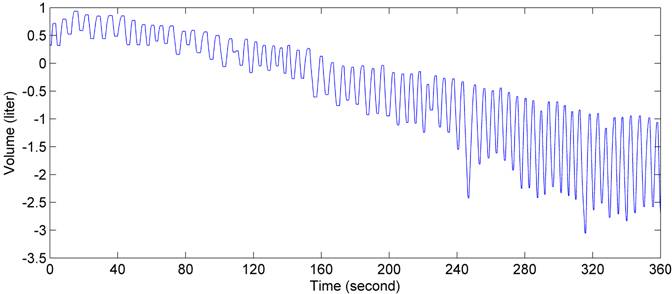
Figure 9 . Respiration volume recorded by the spirometer when the subject re-breathed oxygen-rich air.
4.3 Breath holding
Hyperventilation showed to extend the breath holding time, whereas exercise significantly reduced the breath holding time.The subject was able to hold breath for 128 seconds in normal ventilation and 142 seconds in hyperventilation, but only 30 seconds after exercise. The mechanism of hyperventilation prolonging breath-holding time is that hyperventilation brings larger volume of air into lungs and hence reduces the concentration of carbon dioxide, which is known to be the primary stimulus to the neurons triggering expiration. Exercise, on the other hand, speeds up oxygen consumption and carbon dioxide generation, in turn intensifying ventilation to match the physiological needs of the human body.
4.4 Alveolar Filling
When the two balloons connected to each other were in different size, they did not end up being equal, but instead the smaller one collapsed with all the air moving into the larger one. This phenomenon was due to the surface tension and its resulting pressure. As stated by the law of Laplace, the surface tension on a sphere creates inward pressure that is proportional to the reciprocal of the radius. Therefore, the pressure in the smaller balloon was greater than that in the larger one, driving the former to collapse.
The surface tension in alveoli filling is similar to the balloons. Fluid is lined up in an alveolus, creating a thin fluid layer between the alveolus cell and the air. The surface tension arises at that fluid-air interface, because the surface molecules are attracted by other water molecules beside and underneath them but not from the air.
The surface tension constitutes the primary source of resistance to stretching the lungs. Due to its presence, inspiration consumes energy to expand the lungs. It also ensures that the alveoli are expanded evenly, because otherwise air will move between alveoli of different sizes.
4.5 Lung Model
When the chest was sealed, the pressure in the check is sensitive to the volume change caused by the movement of diaphragm. When the diaphragm moves downward in inspiration, the increased chest volume leads to reduced pressure around the lungs. Since the lungs are connected to the atmosphere, air flows in following the pressure gradient. The opposite situation occurs in expiration.
When the chest was not sealed, however, the pressure in chest is no longer associated with the chest volume, indicating additional energy is required for air intake and ventilation.
This test concluded that the sealed chest ensures that respiration can be efficiently achieved by the diaphragm and related muscles and bones.
4.6 Re-breathing and Respiration Control
When re-breathing room air, the decrease of the concentration of inspired oxygen caused the heart rate to rise consistently. At the start, the concentration of inspired oxygen was 19 mmHg, and the heart rate was 68 beats per minute (BPM); in the end the oxygen concentration dropped to 9 mmHg, whereas the heart rate rose to 101 BPM. Re-breathing in oxygen-rich air reported similar effect but in a smaller scale: the inspired oxygen started dropped from 91 mmHg to 66 mmHg, whereas the heart rate increased from 64 BPM to 79 BPM.
On the other hand, the rise of heart rate was accompanied by a decrease of the oxygen saturation in the bloodstream. This observation was salient in the room-air test (Figure 4 and Figure 5), but obscure in the oxygen-rich re-breathing test, where the oxygen saturation remained above 98% (Figure 8). The obscurity in the latter test could possibly be attributed to the excessive amount of oxygen inhaled by the subject.
The aforementioned two observations lead to our conclusion that the drop of the concentration of inspired oxygen lowers the oxygen saturation, which in turn increases the heart rate. This mechanism can be explained physiological as follows: as the subject lies quietly during the test, the human body can be assumed to consume oxygen in a constant rate; when the oxygen intake reduces, the heart has to accelerate the circulation to maintain the oxygen supply.
In contrast with the inspired oxygen, the expired oxygen appeared not relevant to respiration rate. In the room-air re-breathing test, the concentration of expired oxygen dropped in accordance with the drop of inspired oxygen concentration; but in the other test the concentration of expired oxygen increased from 32 mmHg to 62 mmHg as the inspired oxygen concentration dropped. We conjectured that the expired oxygen is simply not utilized by the human body, so it does not have a direct impact on respiration.
The respiration rate was observed to have increased about 30% in both tests, an amount that is less than our expectation that the breathing rate should be subject to the O2 or CO2 concentration. In the room-air test, the breathing rate slightly rose from 22 times per minute to 28 times per minute as the O2 concentration dropped from 19 mmHg to 9 mmHg. In the oxygen-rich re-breathing test, the breathing rate rose from 18 times per minute to 24 times per minute as the O2 concentration dropped from 91 mmHg to 66 mmHg.
We observed that the concentration of CO2 intake had a positive correlation with the respiration rate and the heart rate. Although this observation is confirmed by the current literature, the scale of CO2’s impact we observed was far from the literature claims that “carbon dioxide is the primary stimulus for changes in ventilation. Oxygen and plasma pH play lesser roles”(Silverthorn, “Humany Physiology”, page 532). The observation was notable in the oxygen-rich re-breathing test, where the inspired CO2 concentration rose dramatically from 5 mmHg to 62 mmHg. Correspondingly, the heart rate increased from 64 BPM to 79 BPM, and the respiration rate increased from 18 times per minute to 24 times per minute. The discrepancy of our results might be caused in two aspects. In the room-air test, the inspired CO2 concentration was too low to have a significant impact (less than 2 mmHg). In the oxygen-rich test, although the CO2 concentration was high, the even higher O2 concentration overwhelmed the CO2 stimulation.
The spirometer volume reveals the respiratory rate and strength. The spirometer volume steadily declined in both tests, because the gas analyzer actively drew approximately 200 mL/min for sampling. In both tests, the tidal volume increased nearly 3 times. To adapt to less oxygen and more carbon dioxide, the subject had to breathe harder and deeper. This observation was consistent with the subject’s own description of his feelings.