SCI Publications
2021


A. Bagherinezhad, M. Young, Bei Wang, M. Parvania.
“Spatio-Temporal Visualization of Interdependent Battery Bus Transit and Power Distribution Systems,” In IEEE PES Innovative Smart Grid Technologies Conference(ISGT), IEEE, 2021.
ABSTRACT
The high penetration of transportation electrification and its associated charging requirements magnify the interdependency of the transportation and power distribution systems. The emergent interdependency requires that system operators fully understand the status of both systems. To this end,a visualization tool is presented to illustrate the inter dependency of battery bus transit and power distribution systems and the associated components. The tool aims at monitoring components from both systems, such as the locations of electric buses, the state of charge of batteries, the price of electricity, voltage, current,and active/reactive power flow. The results showcase the success of the visualization tool in monitoring the bus transit and power distribution components to determine a reliable cost-effective scheme for spatio-temporal charging of electric buses.
A. Rathore, N. Chalapathi, S. Palande, Bei Wang.
“TopoAct: Visually Exploring the Shape of Activations in Deep Learning,” In Computer Graphics Forum, Vol. 40, No. 1, pp. 382-397. 2021.
ABSTRACT
Deep neural networks such as GoogLeNet, ResNet, and BERT have achieved impressive performance in tasks such as image and text classification. To understand how such performance is achieved, we probe a trained deep neural network by studying neuron activations, i.e., combinations of neuron firings, at various layers of the network in response to a particular input. With a large number of inputs, we aim to obtain a global view of what neurons detect by studying their activations. In particular, we develop visualizations that show the shape of the activation space, the organizational principle behind neuron activations, and the relationships of these activations within a layer. Applying tools from topological data analysis, we present TopoAct, a visual exploration system to study topological summaries of activation vectors. We present exploration scenarios using TopoAct that provide valuable insights into learned representations of neural networks. We expect TopoAct to give a topological perspective that enriches the current toolbox of neural network analysis, and to provide a basis for network architecture diagnosis and data anomaly detection.
Y. Zhou, N. Chalapathi, A. Rathore, Y. Zhao, Bei Wang.
“Mapper Interactive: A Scalable, Extendable, and Interactive Toolbox for the Visual Exploration of High-Dimensional Data.,” In IEEE Pacific Visualization Symposium, 2021.
ABSTRACT
The mapper algorithm is a popular tool from topological data analysis for extracting topological summaries of high-dimensional datasets. In this paper, we present Mapper Interactive, a web-based framework for the interactive analysis and visualization of high-dimensional point cloud data. It implements the mapper algorithm in an interactive, scalable, and easily extendable way, thus supporting practical data analysis. In particular, its command-line API can compute mapper graphs for 1 million points of 256 dimensions in about 3 minutes (4 times faster than the vanilla implementation). Its visual interface allows on-the-fly computation and manipulation of the mapper graph based on user-specified parameters and supports the addition of new analysis modules with a few lines of code. Mapper Interactive makes the mapper algorithm accessible to nonspecialists and accelerates topological analytics workflows.
2016
D. Maljovec, S. Liu, Bei Wang, V. Pascucci, P. T. Bremer, D. Mandelli, C. Smith..
“Analyzing Simulation-Based PRA Data Through Traditional and Topological Clustering: A BWR Station Blackout Case Study,” In Reliability Engineering & System Safety, Vol. 145, Elsevier, pp. 262--276. January, 2016.
DOI: 10.1016/j.ress.2015.07.001
ABSTRACT
Dynamic probabilistic risk assessment (DPRA) methodologies couple system simulator codes (e.g., RELAP, MELCOR) with simulation controller codes (e.g., RAVEN, ADAPT). Whereas system simulator codes model system dynamics deterministically, simulation controller codes introduce both deterministic (e.g., system control logic, operating procedures) and stochastic (e.g., component failures, parameter uncertainties) elements into the simulation. Typically, a DPRA is performed by sampling values of a set of parameters, and simulating the system behavior for that specific set of parameter values. For complex systems, a major challenge in using DPRA methodologies is to analyze the large number of scenarios generated, where clustering techniques are typically employed to better organize and interpret the data. In this paper, we focus on the analysis of two nuclear simulation datasets that are part of the risk-informed safety margin characterization (RISMC) boiling water reactor (BWR) station blackout (SBO) case study. We provide the domain experts a software tool that encodes traditional and topological clustering techniques within an interactive analysis and visualization environment, for understanding the structures of such high-dimensional nuclear simulation datasets. We demonstrate through our case study that both types of clustering techniques complement each other in bringing enhanced structural understanding of the data.
E. Wong, S. Palande, Bei Wang, B. Zielinski, J. Anderson, P. T. Fletcher.
“Kernel Partial Least Squares Regression for Relating Functional Brain Network Topology to Clinical Measures of Behavior,” In 2016 IEEE 13th International Symposium on Biomedical Imaging (ISBI), IEEE, April, 2016.
DOI: 10.1109/isbi.2016.7493506
ABSTRACT
In this paper we present a novel method for analyzing the relationship between functional brain networks and behavioral phenotypes. Drawing from topological data analysis, we first extract topological features using persistent homology from functional brain networks that are derived from correlations in resting-state fMRI. Rather than fixing a discrete network topology by thresholding the connectivity matrix, these topological features capture the network organization across all continuous threshold values. We then propose to use a kernel partial least squares (kPLS) regression to statistically quantify the relationship between these topological features and behavior measures. The kPLS also provides an elegant way to combine multiple image features by using linear combinations of multiple kernels. In our experiments we test the ability of our proposed brain network analysis to predict autism severity from rs-fMRI. We show that combining correlations with topological features gives better prediction of autism severity than using correlations alone.
2015
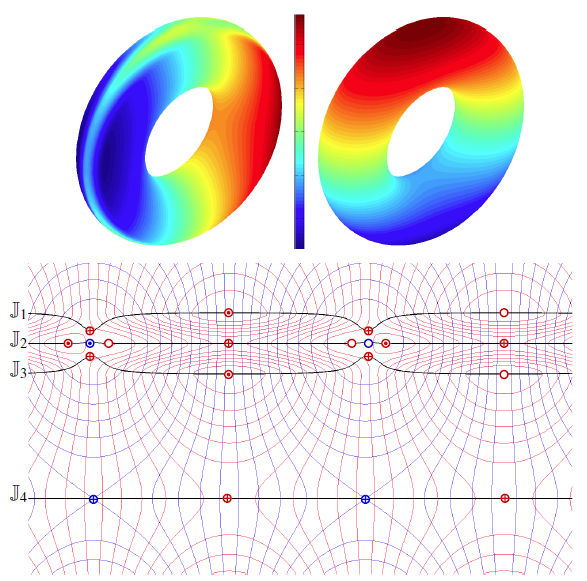
H. Bhatia, Bei Wang, G. Norgard, V. Pascucci, P. T. Bremer.
“Local, Smooth, and Consistent Jacobi Set Simplification,” In Computational Geometry, Vol. 48, No. 4, Elsevier, pp. 311-332. May, 2015.
DOI: 10.1016/j.comgeo.2014.10.009
ABSTRACT
The relation between two Morse functions defined on a smooth, compact, and orientable 2-manifold can be studied in terms of their Jacobi set. The Jacobi set contains points in the domain where the gradients of the two functions are aligned. Both the Jacobi set itself as well as the segmentation of the domain it induces, have shown to be useful in various applications. In practice, unfortunately, functions often contain noise and discretization artifacts, causing their Jacobi set to become unmanageably large and complex. Although there exist techniques to simplify Jacobi sets, they are unsuitable for most applications as they lack fine-grained control over the process, and heavily restrict the type of simplifications possible.
This paper introduces the theoretical foundations of a new simplification framework for Jacobi sets. We present a new interpretation of Jacobi set simplification based on the perspective of domain segmentation. Generalizing the cancellation of critical points from scalar functions to Jacobi sets, we focus on simplifications that can be realized by smooth approximations of the corresponding functions, and show how these cancellations imply simultaneous simplification of contiguous subsets of the Jacobi set. Using these extended cancellations as atomic operations, we introduce an algorithm to successively cancel subsets of the Jacobi set with minimal modifications to some userdefined metric. We show that for simply connected domains, our algorithm reduces a given Jacobi set to its
minimal configuration, that is, one with no birth-death points (a birth-death point is a specific type of singularity within the Jacobi set where the level sets of the two functions and the Jacobi set have a common normal direction).
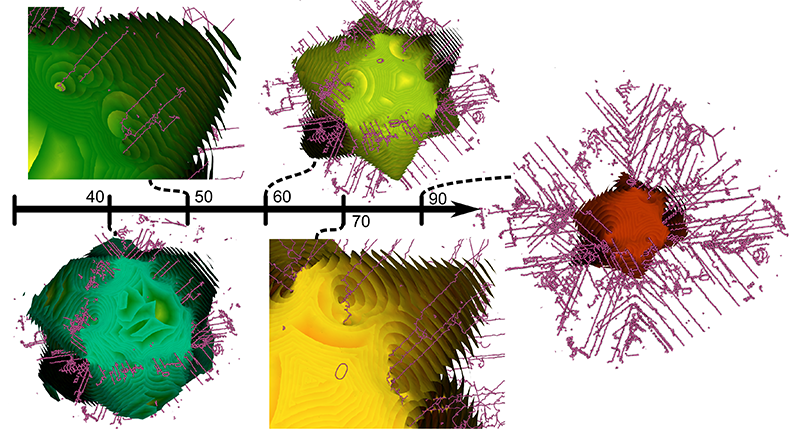
P. T. Bremer, D. Maljovec, A. Saha, Bei Wang, J. Gaffney, B. K. Spears, V. Pascucci.
“ND2AV: N-Dimensional Data Analysis and Visualization -- Analysis for the National Ignition Campaign,” In Computing and Visualization in Science, 2015.
ABSTRACT
One of the biggest challenges in high-energy physics is to analyze a complex mix of experimental and simulation data to gain new insights into the underlying physics. Currently, this analysis relies primarily on the intuition of trained experts often using nothing more sophisticated than default scatter plots. Many advanced analysis techniques are not easily accessible to scientists and not flexible enough to explore the potentially interesting hypotheses in an intuitive manner. Furthermore, results from individual techniques are often difficult to integrate, leading to a confusing patchwork of analysis snippets too cumbersome for data exploration. This paper presents a case study on how a combination of techniques from statistics, machine learning, topology, and visualization can have a significant impact in the field of inertial confinement fusion. We present the ND2AV: N-Dimensional Data Analysis and Visualization framework, a user-friendly tool aimed at exploiting the intuition and current work flow of the target users. The system integrates traditional analysis approaches such as dimension reduction and clustering with state-of-the-art techniques such as neighborhood graphs and topological analysis, and custom capabilities such as defining combined metrics on the fly. All components are linked into an interactive environment that enables an intuitive exploration of a wide variety of hypotheses while relating the results to concepts familiar to the users, such as scatter plots. ND2AV uses a modular design providing easy extensibility and customization for different applications. ND2AV is being actively used in the National Ignition Campaign and has already led to a number of unexpected discoveries.
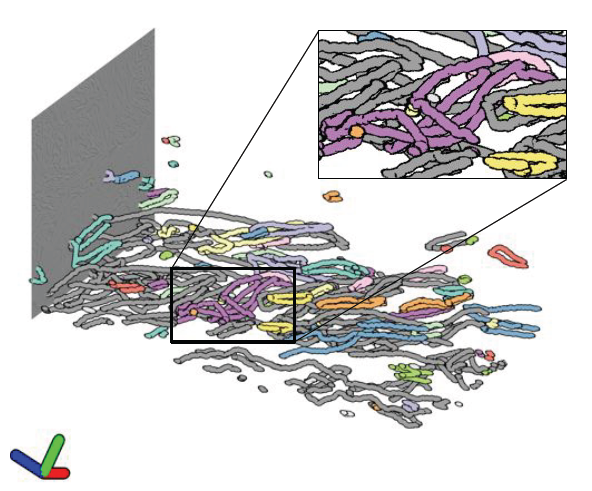
A. Gyulassy, A. Knoll, K. C. Lau, Bei Wang, P. T. Bremer, M. E. Papka, L. A. Curtiss, V. Pascucci.
“Morse-Smale Analysis of Ion Diffusion for DFT Battery Materials Simulations,” In Topology-Based Methods in Visualization (TopoInVis), 2015.
ABSTRACT
Ab initio molecular dynamics (AIMD) simulations are increasingly useful in modeling, optimizing and synthesizing materials in energy sciences. In solving Schrodinger's equation, they generate the electronic structure of the simulated atoms as a scalar field. However, methods for analyzing these volume data are not yet common in molecular visualization. The Morse-Smale complex is a proven, versatile tool for topological analysis of scalar fields. In this paper, we apply the discrete Morse-Smale complex to analysis of first-principles battery materials simulations. We consider a carbon nanosphere structure used in battery materials research, and employ Morse-Smale decomposition to determine the possible lithium ion diffusion paths within that structure. Our approach is novel in that it uses the wavefunction itself as opposed distance fields, and that we analyze the 1-skeleton of the Morse-Smale complex to reconstruct our diffusion paths. Furthermore, it is the first application where specific motifs in the graph structure of the complete 1-skeleton define features, namely carbon rings with specific valence. We compare our analysis of DFT data with that of a distance field approximation, and discuss implications on larger classical molecular dynamics simulations.
A. Gyulassy, A. Knoll, K. C. Lau, Bei Wang, PT. Bremer, M.l E. Papka, L. A. Curtiss, V. Pascucci.
“Interstitial and Interlayer Ion Diffusion Geometry Extraction in Graphitic Nanosphere Battery Materials,” In Proceedings IEEE Visualization Conference, 2015.
ABSTRACT
Large-scale molecular dynamics (MD) simulations are commonly used for simulating the synthesis and ion diffusion of battery materials. A good battery anode material is determined by its capacity to store ion or other diffusers. However, modeling of ion diffusion dynamics and transport properties at large length and long time scales would be impossible with current MD codes. To analyze the fundamental properties of these materials, therefore, we turn to geometric and topological analysis of their structure. In this paper, we apply a novel technique inspired by discrete Morse theory to the Delaunay triangulation of the simulated geometry of a thermally annealed carbon nanosphere. We utilize our computed structures to drive further geometric analysis to extract the interstitial diffusion structure as a single mesh. Our results provide a new approach to analyze the geometry of the simulated carbon nanosphere, and new insights into the role of carbon defect size and distribution in determining the charge capacity and charge dynamics of these carbon based battery materials.
S. Liu, D. Maljovec, Bei Wang, P. T. Bremer, V. Pascucci.
“Visualizing High-Dimensional Data: Advances in the Past Decade,” In State of The Art Report, Eurographics Conference on Visualization (EuroVis), 2015.
ABSTRACT
Massive simulations and arrays of sensing devices, in combination with increasing computing resources, have generated large, complex, high-dimensional datasets used to study phenomena across numerous fields of study. Visualization plays an important role in exploring such datasets. We provide a comprehensive survey of advances in high-dimensional data visualization over the past 15 years. We aim at providing actionable guidance for data practitioners to navigate through a modular view of the recent advances, allowing the creation of new visualizations along the enriched information visualization pipeline and identifying future opportunities for visualization research.
S. Liu, Bei Wang, J. J. Thiagarajan, P. T. Bremer, V. Pascucci.
“Visual Exploration of High-Dimensional Data through Subspace Analysis and Dynamic Projections,” In Computer Graphics Forum, Vol. 34, No. 3, Wiley-Blackwell, pp. 271--280. June, 2015.
DOI: 10.1111/cgf.12639
ABSTRACT

We introduce a novel interactive framework for visualizing and exploring high-dimensional datasets based on subspace analysis and dynamic projections. We assume the high-dimensional dataset can be represented by a mixture of low-dimensional linear subspaces with mixed dimensions, and provide a method to reliably estimate the intrinsic dimension and linear basis of each subspace extracted from the subspace clustering. Subsequently, we use these bases to define unique 2D linear projections as viewpoints from which to visualize the data. To understand the relationships among the different projections and to discover hidden patterns, we connect these projections through dynamic projections that create smooth animated transitions between pairs of projections. We introduce the view transition graph, which provides flexible navigation among these projections to facilitate an intuitive exploration. Finally, we provide detailed comparisons with related systems, and use real-world examples to demonstrate the novelty and usability of our proposed framework.
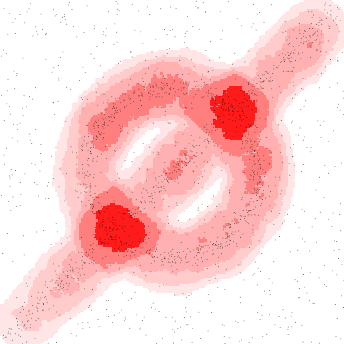
J. M. Phillips, Bei Wang, Y. Zheng.
“Geometric Inference on Kernel Density Estimates,” In CoRR, Vol. abs/1307.7760, 2015.
ABSTRACT
We show that geometric inference of a point cloud can be calculated by examining its kernel density estimate with a Gaussian kernel. This allows one to consider kernel density estimates, which are robust to spatial noise, subsampling, and approximate computation in comparison to raw point sets. This is achieved by examining the sublevel sets of the
kernel distance, which isomorphically map to superlevel sets of the kernel density estimate. We prove new properties about the kernel distance, demonstrating stability results and allowing it to inherit reconstruction results from recent advances in distance-based topological reconstruction. Moreover, we provide an algorithm to estimate its topology using weighted Vietoris-Rips complexes.
P. Skraba, Bei Wang, G. Chen, P. Rosen.
“Robustness-Based Simplification of 2D Steady and Unsteady Vector Fields,” In IEEE Transactions on Visualization and Computer Graphics (to appear), 2015.
ABSTRACT
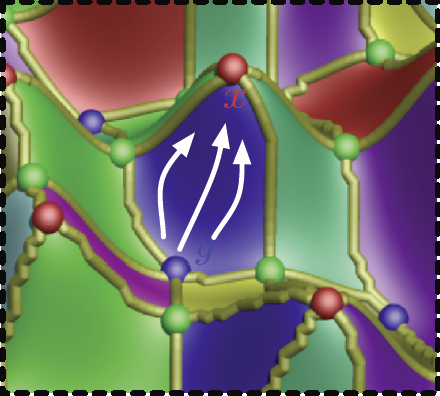
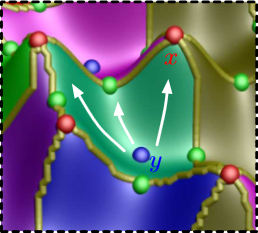
Vector field simplification aims to reduce the complexity of the flow by removing features in order of their relevance and importance, to reveal prominent behavior and obtain a compact representation for interpretation. Most existing simplification techniques based on the topological skeleton successively remove pairs of critical points connected by separatrices, using distance or area-based relevance measures. These methods rely on the stable extraction of the topological skeleton, which can be difficult due to instability in numerical integration, especially when processing highly rotational flows. In this paper, we propose a novel simplification scheme derived from the recently introduced topological notion of robustness which enables the pruning of sets of critical points according to a quantitative measure of their stability, that is, the minimum amount of vector field perturbation required to remove them. This leads to a hierarchical simplification scheme that encodes flow magnitude in its perturbation metric. Our novel simplification algorithm is based on degree theory and has minimal boundary restrictions. Finally, we provide an implementation under the piecewise-linear setting and apply it to both synthetic and real-world datasets. We show local and complete hierarchical simplifications for steady as well as unsteady vector fields.
2014
Shusen Liu, Bei Wang, J.J. Thiagarajan, P.-T. Bremer, V. Pascucci.
“Visual Exploration of High-Dimensional Data: Subspace Analysis through Dynamic Projections,” SCI Technical Report, No. UUSCI-2014-003, SCI Institute, University of Utah, 2014.
ABSTRACT
Understanding high-dimensional data is rapidly becoming a central challenge in many areas of science and engineering. Most current techniques either rely on manifold learning based techniques which typically create a single embedding of the data or on subspace selection to find subsets of the original attributes that highlight the structure. However, the former creates a single, difficult-to-interpret view and assumes the data to be drawn from a single manifold, while the latter is limited to axis-aligned projections with restrictive viewing angles. Instead, we introduce ideas based on subspace clustering that can faithfully represent more complex data than the axis-aligned projections, yet do not assume the data to lie on a single manifold. In particular, subspace clustering assumes that the data can be represented by a union of low-dimensional subspaces, which can subsequently be used for analysis and visualization. In this paper, we introduce new techniques to reliably estimate both the intrinsic dimension and the linear basis of a mixture of subspaces extracted through subspace clustering. We show that the resulting bases represent the high-dimensional structures more reliably than traditional approaches. Subsequently, we use the bases to define different “viewpoints”, i.e., different projections onto pairs of basis vectors, from which to visualize the data. While more intuitive than non-linear projections, interpreting linear subspaces in terms of the original dimensions can still be challenging. To address this problem, we present new, animated transitions between different views to help the user navigate and explore the high-dimensional space. More specifically, we introduce the view transition graph which contains nodes for each subspace viewpoint and edges for potential transition between views. The transition graph enables users to explore both the structure within a subspace and the relations between different subspaces, for better understanding of the data. Using a number of case studies on well-know reference datasets, we demonstrate that the interactive exploration through such dynamic projections provides additional insights not readily available from existing tools.
Keywords: High-dimensional data, Subspace, Dynamic projection
S. Liu, Bei Wang, P.-T. Bremer, V. Pascucci.
“Distortion-Guided Structure-Driven Interactive Exploration of High-Dimensional Data,” In Computer Graphics Forum, Vol. 33, No. 3, Wiley-Blackwell, pp. 101--110. June, 2014.
ABSTRACT
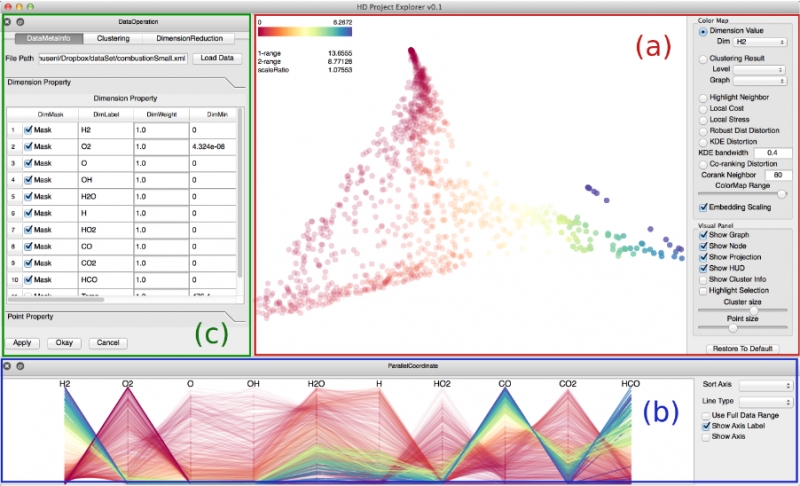
Dimension reduction techniques are essential for feature selection and feature extraction of complex high-dimensional data. These techniques, which construct low-dimensional representations of data, are typically geometrically motivated, computationally efficient and approximately preserve certain structural properties of the data. However, they are often used as black box solutions in data exploration and their results can be difficult to interpret. To assess the quality of these results, quality measures, such as co-ranking [ LV09 ], have been proposed to quantify structural distortions that occur between high-dimensional and low-dimensional data representations. Such measures could be evaluated and visualized point-wise to further highlight erroneous regions [ MLGH13 ]. In this work, we provide an interactive visualization framework for exploring high-dimensional data via its two-dimensional embeddings obtained from dimension reduction, using a rich set of user interactions. We ask the following question: what new insights do we obtain regarding the structure of the data, with interactive manipulations of its embeddings in the visual space? We augment the two-dimensional embeddings with structural abstrac- tions obtained from hierarchical clusterings, to help users navigate and manipulate subsets of the data. We use point-wise distortion measures to highlight interesting regions in the domain, and further to guide our selection of the appropriate level of clusterings that are aligned with the regions of interest. Under the static setting, point-wise distortions indicate the level of structural uncertainty within the embeddings. Under the dynamic setting, on-the-fly updates of point-wise distortions due to data movement and data deletion reflect structural relations among different parts of the data, which may lead to new and valuable insights.
Shusen Liu, Bei Wang, J.J. Thiagarajan, P.-T. Bremer, V. Pascucci.
“Multivariate Volume Visualization through Dynamic Projections,” In Proceedings of the IEEE Symposium on Large Data Analysis and Visualization (LDAV), 2014.
ABSTRACT
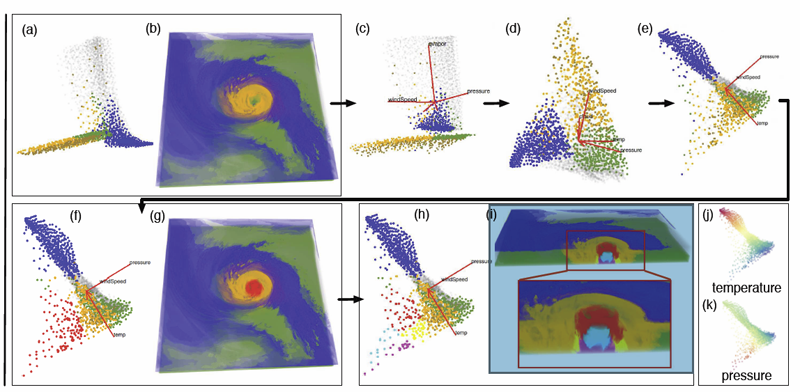
We propose a multivariate volume visualization framework that tightly couples dynamic projections with a high-dimensional transfer function design for interactive volume visualization. We assume that the complex, high-dimensional data in the attribute space can be well-represented through a collection of low-dimensional linear subspaces, and embed the data points in a variety of 2D views created as projections onto these subspaces. Through dynamic projections, we present animated transitions between different views to help the user navigate and explore the attribute space for effective transfer function design. Our framework not only provides a more intuitive understanding of the attribute space but also allows the design of the transfer function under multiple dynamic views, which is more flexible than being restricted to a single static view of the data. For large volumetric datasets, we maintain interactivity during the transfer function design via intelligent sampling and scalable clustering. Using examples in combustion and climate simulations, we demonstrate how our framework can be used to visualize interesting structures in the volumetric space.
D. Maljovec, Bei Wang, J. Moeller, V. Pascucci.
“Topology-Based Active Learning,” SCI Technical Report, No. UUSCI-2014-001, SCI Institute, University of Utah, 2014.
ABSTRACT
A common problem in simulation and experimental research involves obtaining time-consuming, expensive, or potentially hazardous samples from an arbitrary dimension parameter space. For example, many simulations modeled on supercomputers can take days or weeks to complete, so it is imperative to select samples in the most informative and interesting areas of the parameter space. In such environments, maximizing the potential gain of information is achieved through active learning (adaptive sampling). Though the topic of active learning is well-studied, this paper provides a new perspective on the problem. We consider topologybased batch selection strategies for active learning which are ideal for environments where parallel or concurrent experiments are able to be run, yet each has a heavy cost. These strategies utilize concepts derived from computational topology to choose a collection of locally distinct, optimal samples before updating the surrogate model. We demonstrate through experiments using a several different batch sizes that topology-based strategies have comparable and sometimes superior performance, compared to conventional approaches.
D. Maljovec, S. Liu, Bei Wang, V. Pascucci, P.-T. Bremer, D. Mandelli, C. Smith.
“Analyzing Simulation-Based PRA Data Through Clustering: a BWR Station Blackout Case Study,” In Proceedings of the Probabilistic Safety Assessment & Management conference (PSAM), 2014.
ABSTRACT
Dynamic probabilistic risk assessment (DPRA) methodologies couple system simulator codes (e.g., RELAP, MELCOR) with simulation controller codes (e.g., RAVEN, ADAPT). Whereas system simulator codes accurately model system dynamics deterministically, simulation controller codes introduce both deterministic (e.g., system control logic, operating procedures) and stochastic (e.g., component failures, parameter uncertainties) elements into the simulation. Typically, a DPRA is performed by 1) sampling values of a set of parameters from the uncertainty space of interest (using the simulation controller codes), and 2) simulating the system behavior for that specific set of parameter values (using the system simulator codes). For complex systems, one of the major challenges in using DPRA methodologies is to analyze the large amount of information (i.e., large number of scenarios ) generated, where clustering techniques are typically employed to allow users to better organize and interpret the data. In this paper, we focus on the analysis of a nuclear simulation dataset that is part of the risk-informed safety margin characterization (RISMC) boiling water reactor (BWR) station blackout (SBO) case study. We apply a software tool that provides the domain experts with an interactive analysis and visualization environment for understanding the structures of such high-dimensional nuclear simulation datasets. Our tool encodes traditional and topology-based clustering techniques, where the latter partitions the data points into clusters based on their uniform gradient flow behavior. We demonstrate through our case study that both types of clustering techniques complement each other in bringing enhanced structural understanding of the data.
Keywords: PRA, computational topology, clustering, high-dimensional analysis
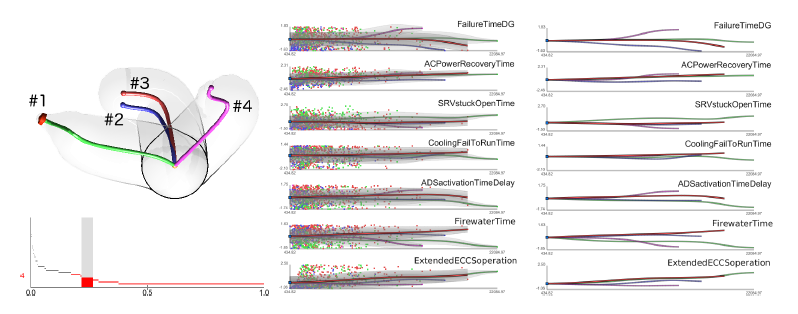
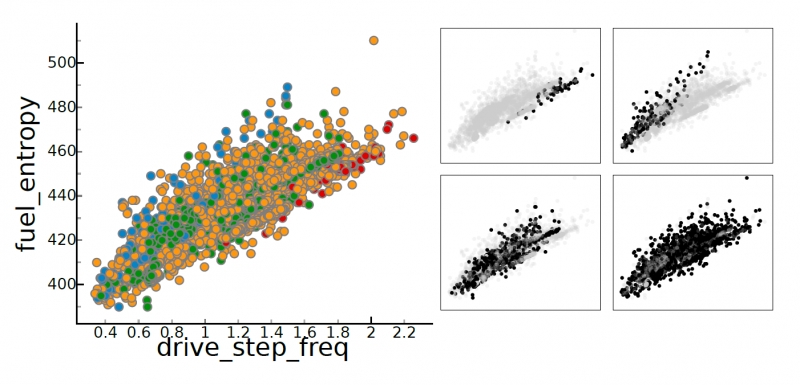
D. Mandelli, C. Smith, T. Riley, J. Nielsen, J. Schroeder, C. Rabiti, A. Alfonsi, J. Cogliati, R. Kinoshita, V. Pascucci, Bei Wang, D. Maljovec.
“Overview of New Tools to Perform Safety Analysis: BWR Station Black Out Test Case,” In Proceedings of the Probabilistic Safety Assessment & Management conference (PSAM), 2014.
ABSTRACT
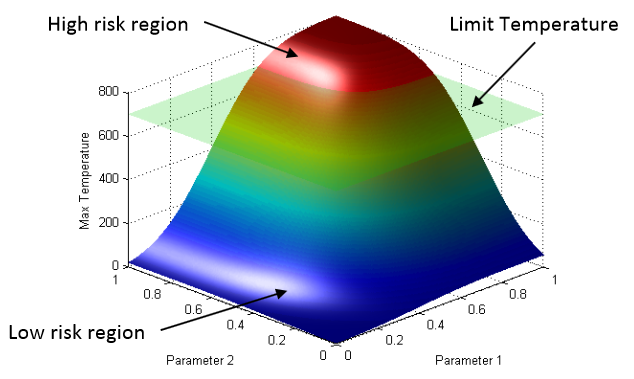
The existing fleet of nuclear power plants is in the process of extending its lifetime and increasing the power generated from these plants via power uprates. In order to evaluate the impacts of these two factors on the safety of the plant, the Risk Informed Safety Margin Characterization project aims to provide insights to decision makers through a series of simulations of the plant dynamics for different initial conditions (e.g., probabilistic analysis and uncertainty quantification). This paper focuses on the impacts of power uprate on the safety margin of a boiling water reactor for a station black-out event. Analysis is performed by using a combination of thermal-hydraulic codes and a stochastic analysis tool currently under development at the Idaho National Laboratory, i.e. RAVEN. We employed both classical statistical tools, i.e. Monte-Carlo, and more advanced machine learning based algorithms to perform uncertainty quantification in order to quantify changes in system performance and limitations as a consequence of power uprate. We also employed advanced data analysis and visualization tools that helped us to correlate simulation outcomes such as maximum core temperature with a set of input uncertain parameters. Results obtained give a detailed investigation of the issues associated with a plant power uprate including the effects of station black-out accident scenarios. We were able to quantify how the timing of specific events was impacted by a higher nominal reactor core power. Such safety insights can provide useful information to the decision makers to perform risk-informed margins management.
P. Skraba, Bei Wang, G. Chen, P. Rosen.
“2D Vector Field Simplification Based on Robustness,” In Proceedings of the 2014 IEEE Pacific Visualization Symposium, PacificVis, Note: Awarded Best Paper!, 2014.
ABSTRACT

Vector field simplification aims to reduce the complexity of the flow by removing features in order of their relevance and importance, to reveal prominent behavior and obtain a compact representation for interpretation. Most existing simplification techniques based on the topological skeleton successively remove pairs of critical points connected by separatrices, using distance or area-based relevance measures. These methods rely on the stable extraction of the topological skeleton, which can be difficult due to instability in numerical integration, especially when processing highly rotational flows. These geometric metrics do not consider the flow magnitude, an important physical property of the flow. In this paper, we propose a novel simplification scheme derived from the recently introduced topological notion of robustness, which provides a complementary view on flow structure compared to the traditional topological-skeleton-based approaches. Robustness enables the pruning of sets of critical points according to a quantitative measure of their stability, that is, the minimum amount of vector field perturbation required to remove them. This leads to a hierarchical simplification scheme that encodes flow magnitude in its perturbation metric. Our novel simplification algorithm is based on degree theory, has fewer boundary restrictions, and so can handle more general cases. Finally, we provide an implementation under the piecewise-linear setting and apply it to both synthetic and real-world datasets.
Keywords: vector field, topology-based techniques, flow visualization