SCI Publications
2016


M. Larsen, K. Moreland, C.R. Johnson,, H. Childs.
“Optimizing Multi-Image Sort-Last Parallel Rendering,” In Symposium on Large Data Analysis and Visualization, IEEE, 2016.
Sort-last parallel rendering can be improved by considering the rendering of multiple images at a time. Most parallel rendering algorithms consider the generation of only a single image. This makes sense when performing interactive rendering where the parameters of each rendering are not known until the previous rendering completes. However, in situ visualization often generates multiple images that do not need to be created sequentially. In this paper we present a simple and effective approach to improving parallel image generation throughput by amortizing the load and overhead among multiple image renders. Additionally, we validate our approach by conducting a performance study exploring the achievable speed-ups in a variety of image-based in situ use cases and rendering workloads. On average, our approach shows a 1.5 to 3.7 fold improvement in performance, and in some cases, shows a 10 fold improvement.
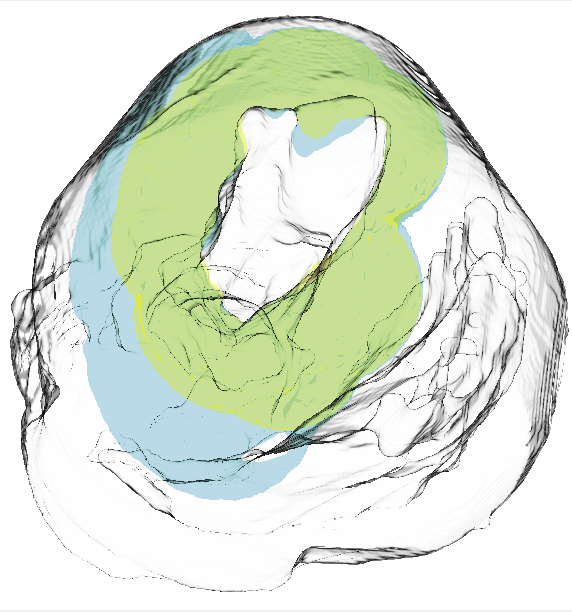
P. Rosen, B. Burton, K. Potter, C.R. Johnson.
“muView: A Visual Analysis System for Exploring Uncertainty in Myocardial Ischemia Simulations,” In Visualization in Medicine and Life Sciences III, Springer Nature, pp. 49--69. 2016.
DOI: 10.1007/978-3-319-24523-2_3

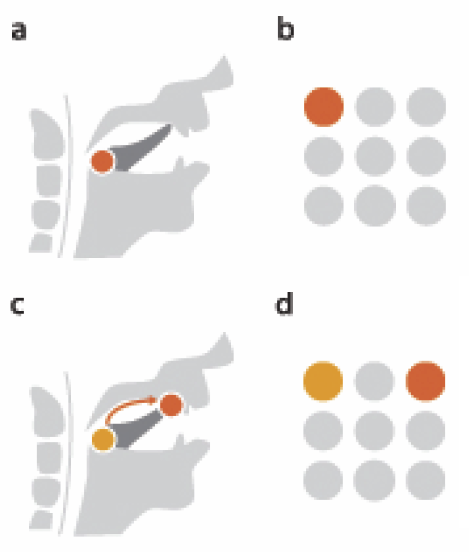
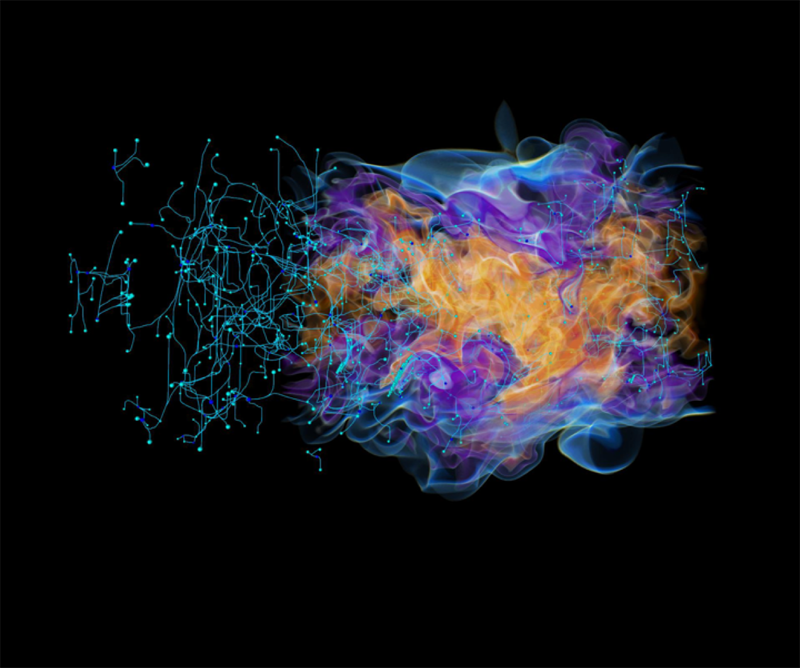
X. Tong, J. Edwards, C. Chen, H. Shen, C. R. Johnson, P. Wong.
“View-Dependent Streamline Deformation and Exploration,” In Transactions on Visualization and Computer Graphics, Vol. 22, No. 7, IEEE, pp. 1788--1801. July, 2016.
ISSN: 1077-2626
DOI: 10.1109/tvcg.2015.2502583
Occlusion presents a major challenge in visualizing 3D flow and tensor fields using streamlines. Displaying too many streamlines creates a dense visualization filled with occluded structures, but displaying too few streams risks losing important features. We propose a new streamline exploration approach by visually manipulating the cluttered streamlines by pulling visible layers apart and revealing the hidden structures underneath. This paper presents a customized view-dependent deformation algorithm and an interactive visualization tool to minimize visual clutter in 3D vector and tensor fields. The algorithm is able to maintain the overall integrity of the fields and expose previously hidden structures. Our system supports both mouse and direct-touch interactions to manipulate the viewing perspectives and visualize the streamlines in depth. By using a lens metaphor of different shapes to select the transition zone of the targeted area interactively, the users can move their focus and examine the vector or tensor field freely.
Keywords: Context;Deformable models;Lenses;Shape;Streaming media;Three-dimensional displays;Visualization;Flow visualization;deformation;focus+context;occlusion;streamline;white matter tracts
2015
C.R. Johnson, K. Potter.
“Visualization,” In The Princeton Companion to Applied Mathematics, Edited by Nicholas J. Higham, Princeton University Press, pp. 843-846. September, 2015.
ISBN: 9780691150390
H. De Sterck, C.R. Johnson.
“Data Science: What Is It and How Is It Taught?,” In SIAM News, SIAM, July, 2015.
C.R. Johnson.
“Computational Methods and Software for Bioelectric Field Problems,” In Biomedical Engineering Handbook, 4, Vol. 1, Ch. 43, Edited by J.D. Bronzino and D.R. Peterson, CRC Press, pp. 1--28. 2015.
Computer modeling and simulation continue to become more important in the field of bioengineering. The reasons for this growing importance are manyfold. First, mathematical modeling has been shown to be a substantial tool for the investigation of complex biophysical phenomena. Second, since the level of complexity one can model parallels the existing hardware configurations, advances in computer architecture have made it feasible to apply the computational paradigm to complex biophysical systems. Hence, while biological complexity continues to outstrip the capabilities of even the largest computational systems, the computational methodology has taken hold in bioengineering and has been used successfully to suggest physiologically and clinically important scenarios and results.
This chapter provides an overview of numerical techniques that can be applied to a class of bioelectric field problems. Bioelectric field problems are found in a wide variety of biomedical applications, which range from single cells, to organs, up to models that incorporate partial to full human structures. We describe some general modeling techniques that will be applicable, in part, to all the aforementioned applications. We focus our study on a class of bioelectric volume conductor problems that arise in electrocardiography (ECG) and electroencephalography (EEG).
We begin by stating the mathematical formulation for a bioelectric volume conductor, continue by describing the model construction process, and follow with sections on numerical solutions and computational considerations. We continue with a section on error analysis coupled with a brief introduction to adaptive methods. We conclude with a section on software.
C.R. Johnson.
“Visualization,” In Encyclopedia of Applied and Computational Mathematics, Edited by Björn Engquist, Springer, pp. 1537-1546. 2015.
ISBN: 978-3-540-70528-4
DOI: 10.1007/978-3-540-70529-1_368
2014
G.P. Bonneau, H.C. Hege, C.R. Johnson, M.M. Oliveira, K. Potter, P. Rheingans, T. Schultz.
“Overview and State-of-the-Art of Uncertainty Visualization,” In Scientific Visualization: Uncertainty, Multifield, Biomedical, and Scalable Visualization, Edited by M. Chen and H. Hagen and C.D. Hansen and C.R. Johnson and A. Kauffman, Springer-Verlag, pp. 3--27. 2014.
ISBN: 978-1-4471-6496-8
ISSN: 1612-3786
DOI: 10.1007/978-1-4471-6497-5_1
B. Chapman, H. Calandra, S. Crivelli, J. Dongarra, J. Hittinger, C.R. Johnson, S.A. Lathrop, V. Sarkar, E. Stahlberg, J.S. Vetter, D. Williams.
“ASCAC Workforce Subcommittee Letter,” Note: Office of Scientific and Technical Information, DOE ASCAC Committee Report, July, 2014.
DOI: 10.2172/1222711
Simulation and computing are essential to much of the research conducted at the DOE national laboratories. Experts in the ASCR-relevant Computing Sciences, which encompass a range of disciplines including Computer Science, Applied Mathematics, Statistics and domain sciences, are an essential element of the workforce in nearly all of the DOE national laboratories. This report seeks to identify the gaps and challenges facing DOE with respect to this workforce.
The DOE laboratories provided the committee with information on disciplines in which they experienced workforce gaps. For the larger laboratories, the majority of the cited workforce gaps were in the Computing Sciences. Since this category spans multiple disciplines, it was difficult to obtain comprehensive information on workforce gaps in the available timeframe. Nevertheless, five multi-purpose laboratories provided additional relevant data on recent hiring and retention.
Data on academic coursework was reviewed. Studies on multidisciplinary education in Computational Science and Engineering (CS&E) revealed that, while the number of CS&E courses offered is growing, the overall availability is low and the coursework fails to provide skills for applying CS&E to real-world applications. The number of graduates in different fields within Computer Science (CS) and Computer Engineering (CE) was also reviewed, which confirmed that specialization in DOE areas of interest is less common than in many other areas.
Projections of industry needs and employment figures (mostly for CS and CE) were examined. They indicate a high and increasing demand for graduates in all areas of computing, with little unemployment. This situation will be exacerbated by large numbers of retirees in the coming decade. Further, relatively few US students study toward higher degrees in the Computing Sciences, and those who do are predominantly white and male. As a result of this demographic imbalance, foreign nationals are an increasing fraction of the graduate population and we fail to benefit from including women and underrepresented minorities.
There is already a program that supports graduate education that is tailored to the needs of the DOE laboratories. The Computational Science Graduate Fellowship (CSGF) enables graduates to pursue a multidisciplinary program of education that is coupled with practical experience at the laboratories. It has been demonstrated to be highly effective in both its educational goals and in its ability to supply talent to the laboratories. However, its current size and scope are too limited to solve the workforce problems identified. The committee felt strongly that this proven program should be extended to increase its ability to support the DOE mission.
Since no single program can eliminate the workforce gap, existing recruitment efforts by the laboratories were examined. It was found that the laboratories already make considerable effort to recruit in this area. Although some challenges, such as the inability to match industry compensation, cannot be directly addressed, DOE could develop a roadmap to increase the impact of individual laboratory efforts, to enhance the suitability of existing educational opportunities, to increase the attractiveness of the laboratories, and to attract and sustain a full spectrum of human talent, which includes women and underrepresented minorities.
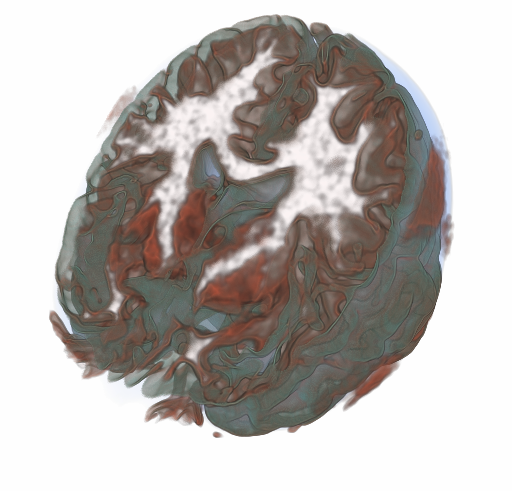
M.G. Genton, C.R. Johnson, K. Potter, G. Stenchikov, Y. Sun.
“Surface boxplots,” In Stat Journal, Vol. 3, No. 1, pp. 1--11. 2014.
In this paper, we introduce a surface boxplot as a tool for visualization and exploratory analysis of samples of images. First, we use the notion of volume depth to order the images viewed as surfaces. In particular, we define the median image. We use an exact and fast algorithm for the ranking of the images. This allows us to detect potential outlying images that often contain interesting features not present in most of the images. Second, we build a graphical tool to visualize the surface boxplot and its various characteristics. A graph and histogram of the volume depth values allow us to identify images of interest. The code is available in the supporting information of this paper. We apply our surface boxplot to a sample of brain images and to a sample of climate model outputs.
Y. Gur, C.R. Johnson.
“Generalized HARDI Invariants by Method of Tensor Contraction,” In Proceedings of the 2014 IEEE International Symposium on Biomedical Imaging (ISBI), pp. 718--721. April, 2014.
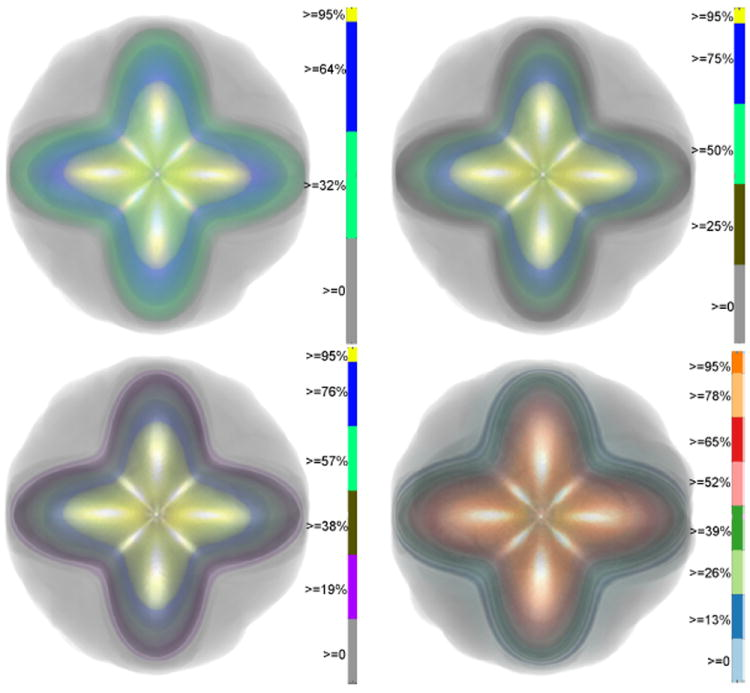
We propose a 3D object recognition technique to construct rotation invariant feature vectors for high angular resolution diffusion imaging (HARDI). This method uses the spherical harmonics (SH) expansion and is based on generating rank-1 contravariant tensors using the SH coefficients, and contracting them with covariant tensors to obtain invariants. The proposed technique enables the systematic construction of invariants for SH expansions of any order using simple mathematical operations. In addition, it allows construction of a large set of invariants, even for low order expansions, thus providing rich feature vectors for image analysis tasks such as classification and segmentation. In this paper, we use this technique to construct feature vectors for eighth-order fiber orientation distributions (FODs) reconstructed using constrained spherical deconvolution (CSD). Using simulated and in vivo brain data, we show that these invariants are robust to noise, enable voxel-wise classification, and capture meaningful information on the underlying white matter structure.
Keywords: Diffusion MRI, HARDI, invariants
C.D. Hansen, M. Chen, C.R. Johnson, A.E. Kaufman, H. Hagen (Eds.).
“Scientific Visualization: Uncertainty, Multifield, Biomedical, and Scalable Visualization,” Mathematics and Visualization, Springer, 2014.
ISBN: 978-1-4471-6496-8
2013
A. Abdul-Rahman, J. Lein, K. Coles, E. Maguire, M.D. Meyer, M. Wynne, C.R. Johnson, A. Trefethen, M. Chen.
“Rule-based Visual Mappings - with a Case Study on Poetry Visualization,” In Proceedings of the 2013 Eurographics Conference on Visualization (EuroVis), Vol. 32, No. 3, pp. 381--390. June, 2013.
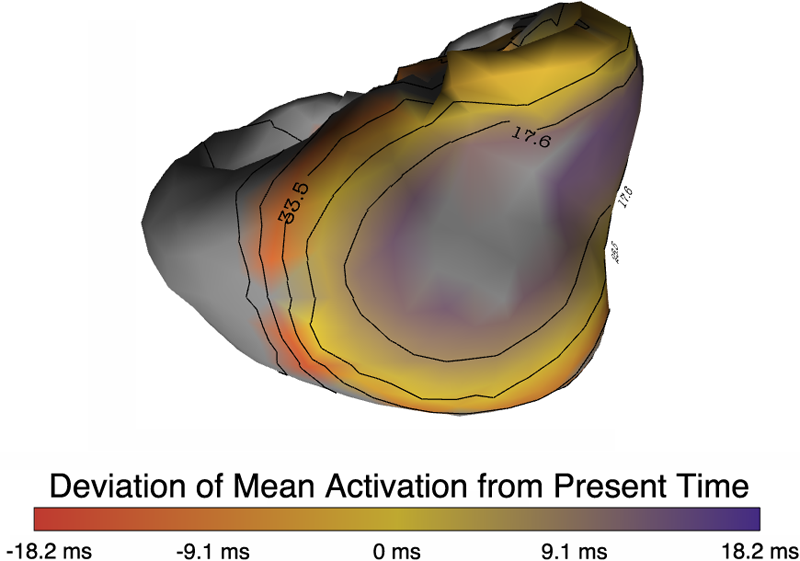
B. Burton, B. Erem, K. Potter, P. Rosen, C.R. Johnson, D. Brooks, R.S. Macleod.
“Uncertainty Visualization in Forward and Inverse Cardiac Models,” In Computing in Cardiology CinC, pp. 57--60. 2013.
ISSN: 2325-8861
J. Chen, A. Choudhary, S. Feldman, B. Hendrickson, C.R. Johnson, R. Mount, V. Sarkar, V. White, D. Williams.
“Synergistic Challenges in Data-Intensive Science and Exascale Computing,” Note: Summary Report of the Advanced Scientific Computing Advisory Committee (ASCAC) Subcommittee, March, 2013.
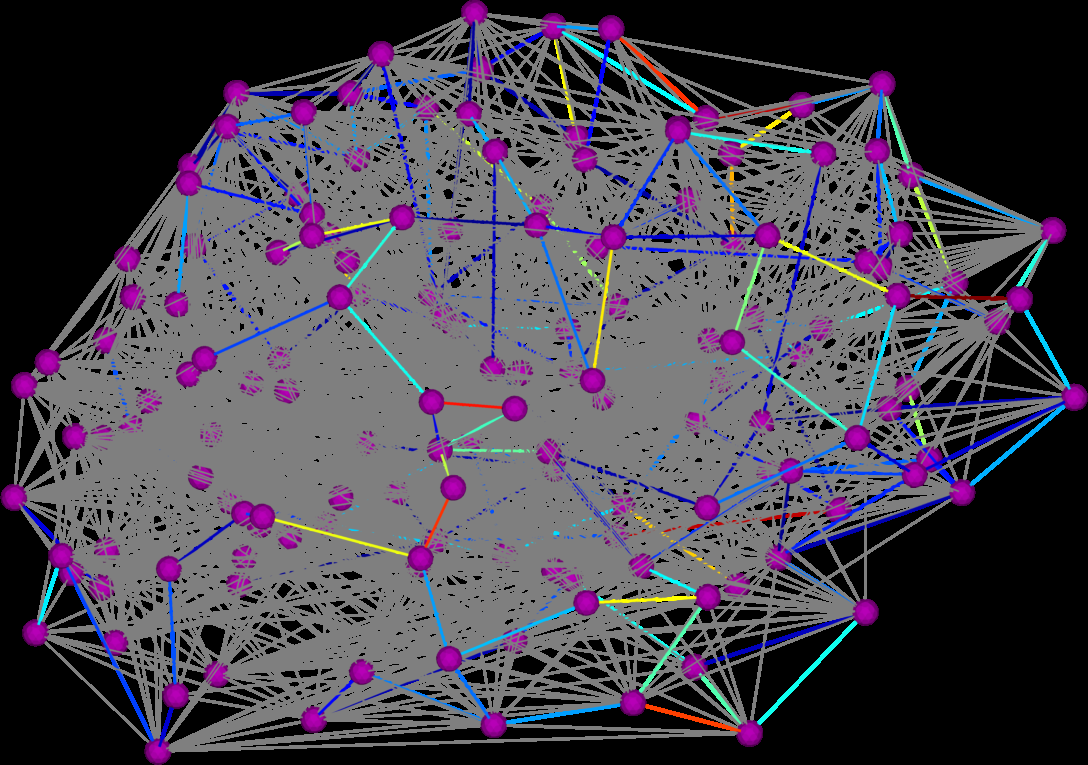
D.K. Hammond, Y. Gur, C.R. Johnson.
“Graph Diffusion Distance: A Difference Measure for Weighted Graphs Based on the Graph Laplacian Exponential Kernel,” In Proceedings of the IEEE global conference on information and signal processing (GlobalSIP'13), Austin, Texas, pp. 419--422. 2013.
DOI: 10.1109/GlobalSIP.2013.6736904
F. Jiao, J.M. Phillips, Y. Gur, C.R. Johnson.
“Uncertainty Visualization in HARDI based on Ensembles of ODFs,” In Proceedings of 2013 IEEE Pacific Visualization Symposium, pp. 193--200. 2013.
PubMed ID: 24466504
PubMed Central ID: PMC3898522
C.R. Johnson, A. Pang (Eds.).
“International Journal for Uncertainty Quantification,” Subtitled “Special Issue on Working with Uncertainty: Representation, Quantification, Propagation, Visualization, and Communication of Uncertainty,” In Int. J. Uncertainty Quantification, Vol. 3, No. 2, Begell House, Inc., pp. vii--viii. 2013.
ISSN: 2152-5080
DOI: 10.1615/Int.J.UncertaintyQuantification.v3.i2
C.R. Johnson, A. Pang (Eds.).
“International Journal for Uncertainty Quantification,” Subtitled “Special Issue on Working with Uncertainty: Representation, Quantification, Propagation, Visualization, and Communication of Uncertainty,” In Int. J. Uncertainty Quantification, Vol. 3, No. 3, Begell House, Inc., 2013.
ISSN: 2152-5080
DOI: 10.1615/Int.J.UncertaintyQuantification.v3.i3
P. Rosen, B. Burton, K. Potter, C.R. Johnson.
“Visualization for understanding uncertainty in the simulation of myocardial ischemia,” In Proceedings of the 2013 Workshop on Visualization in Medicine and Life Sciences, 2013.