|
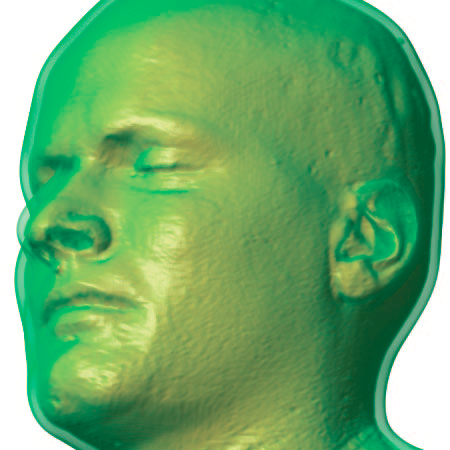
| An Isosurface visualization of a magnetic resonance imaging data set (in orange) surrounded by a volume rendered region of low opacity (in green) to indicate uncertainty in surface position. |
The estimation and visualization of uncertainty information is an important research problem in both simulation and visualization. Uncertainty is a term used to describe the error, confidence, and variation of a dataset in order to allow a scientist to understand the accuracy not only of the data but also of the processes used to explore the data. One such technique, sensitivity analysis, helps the scientist to understand the effects of perturbing parameters of a function. Small perturbations of the input parameters that create large perturbations in the output results can indicate areas of the function that are highly dependent on the input parameters and may be interpreted as unstable or possibly wrong. Sensitivity analysis techniques can be used not only to explore the mathematical models used to generate uncertainty data but also to better understand the effects of input parameters of visualization techniques. Uncertainty data generated from the analysis of a mathematical model reconstructing biological experiment have been a focus of the CIBC team.